11 Regression Analysis
In statistical modelling, regression analysis is a set of statistical processes for estimating the relationships between a dependent variable and one or more independent variables.
11.1 Simple Linear Regression
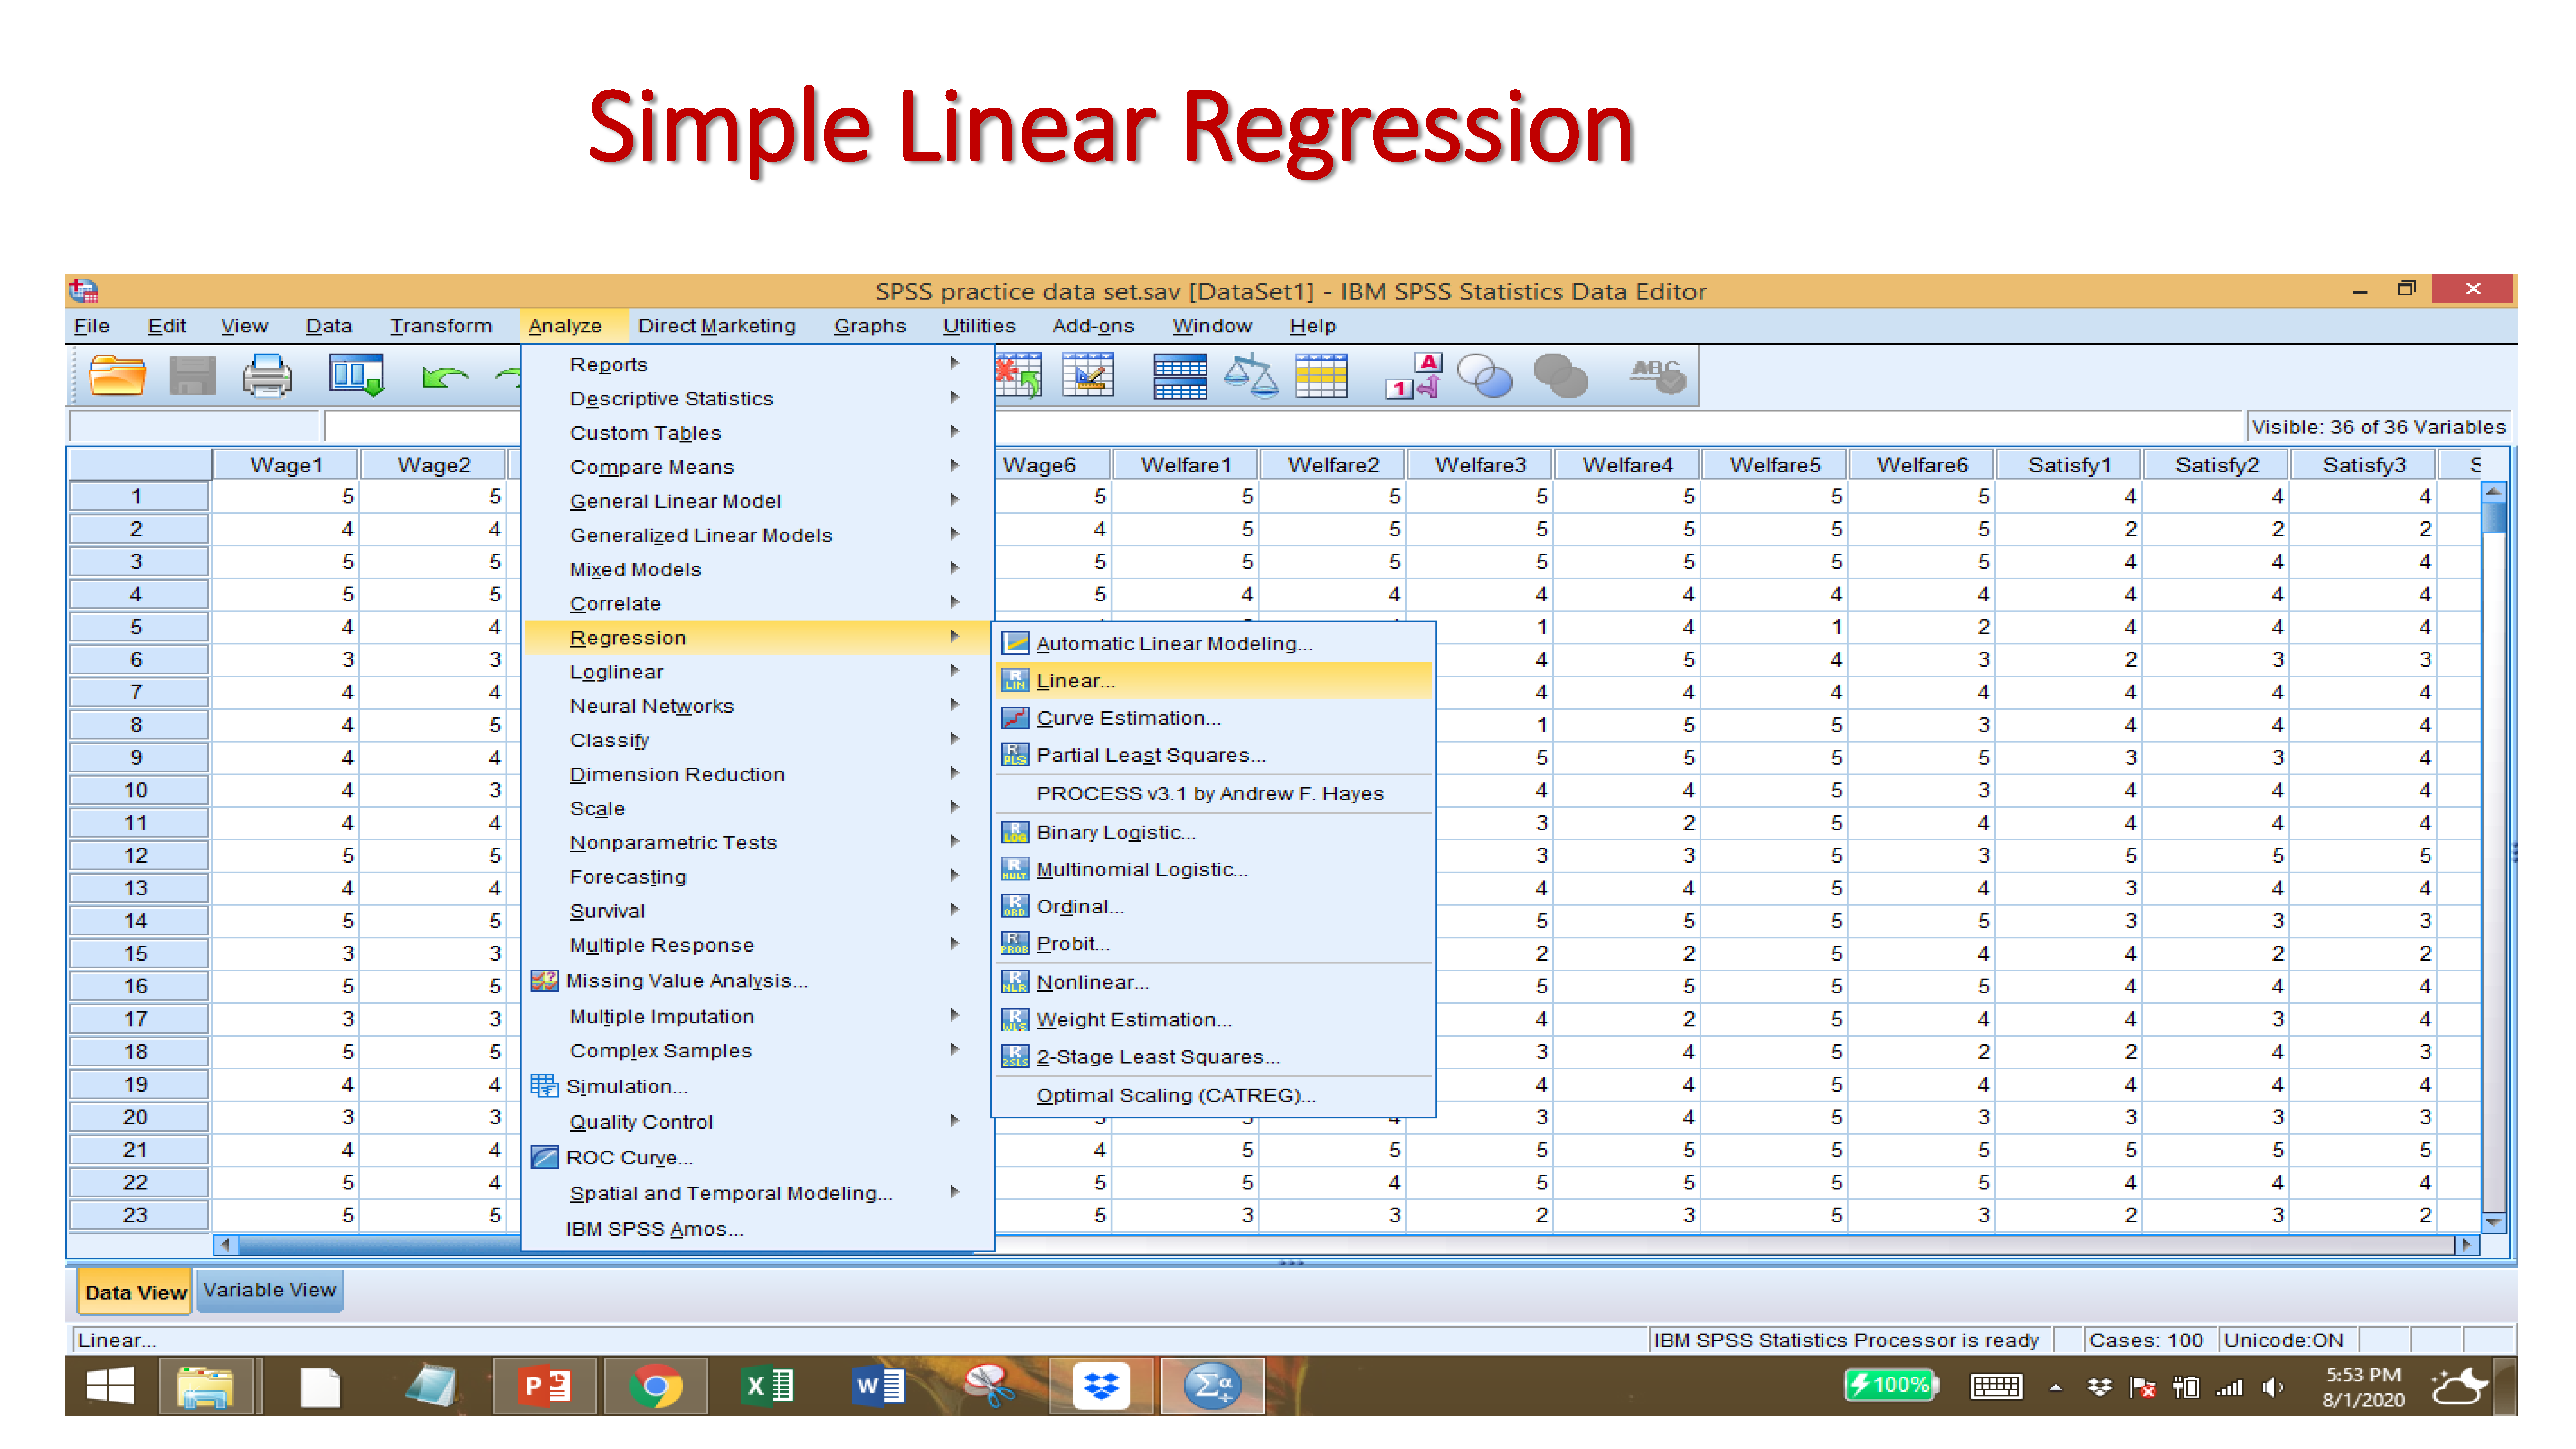
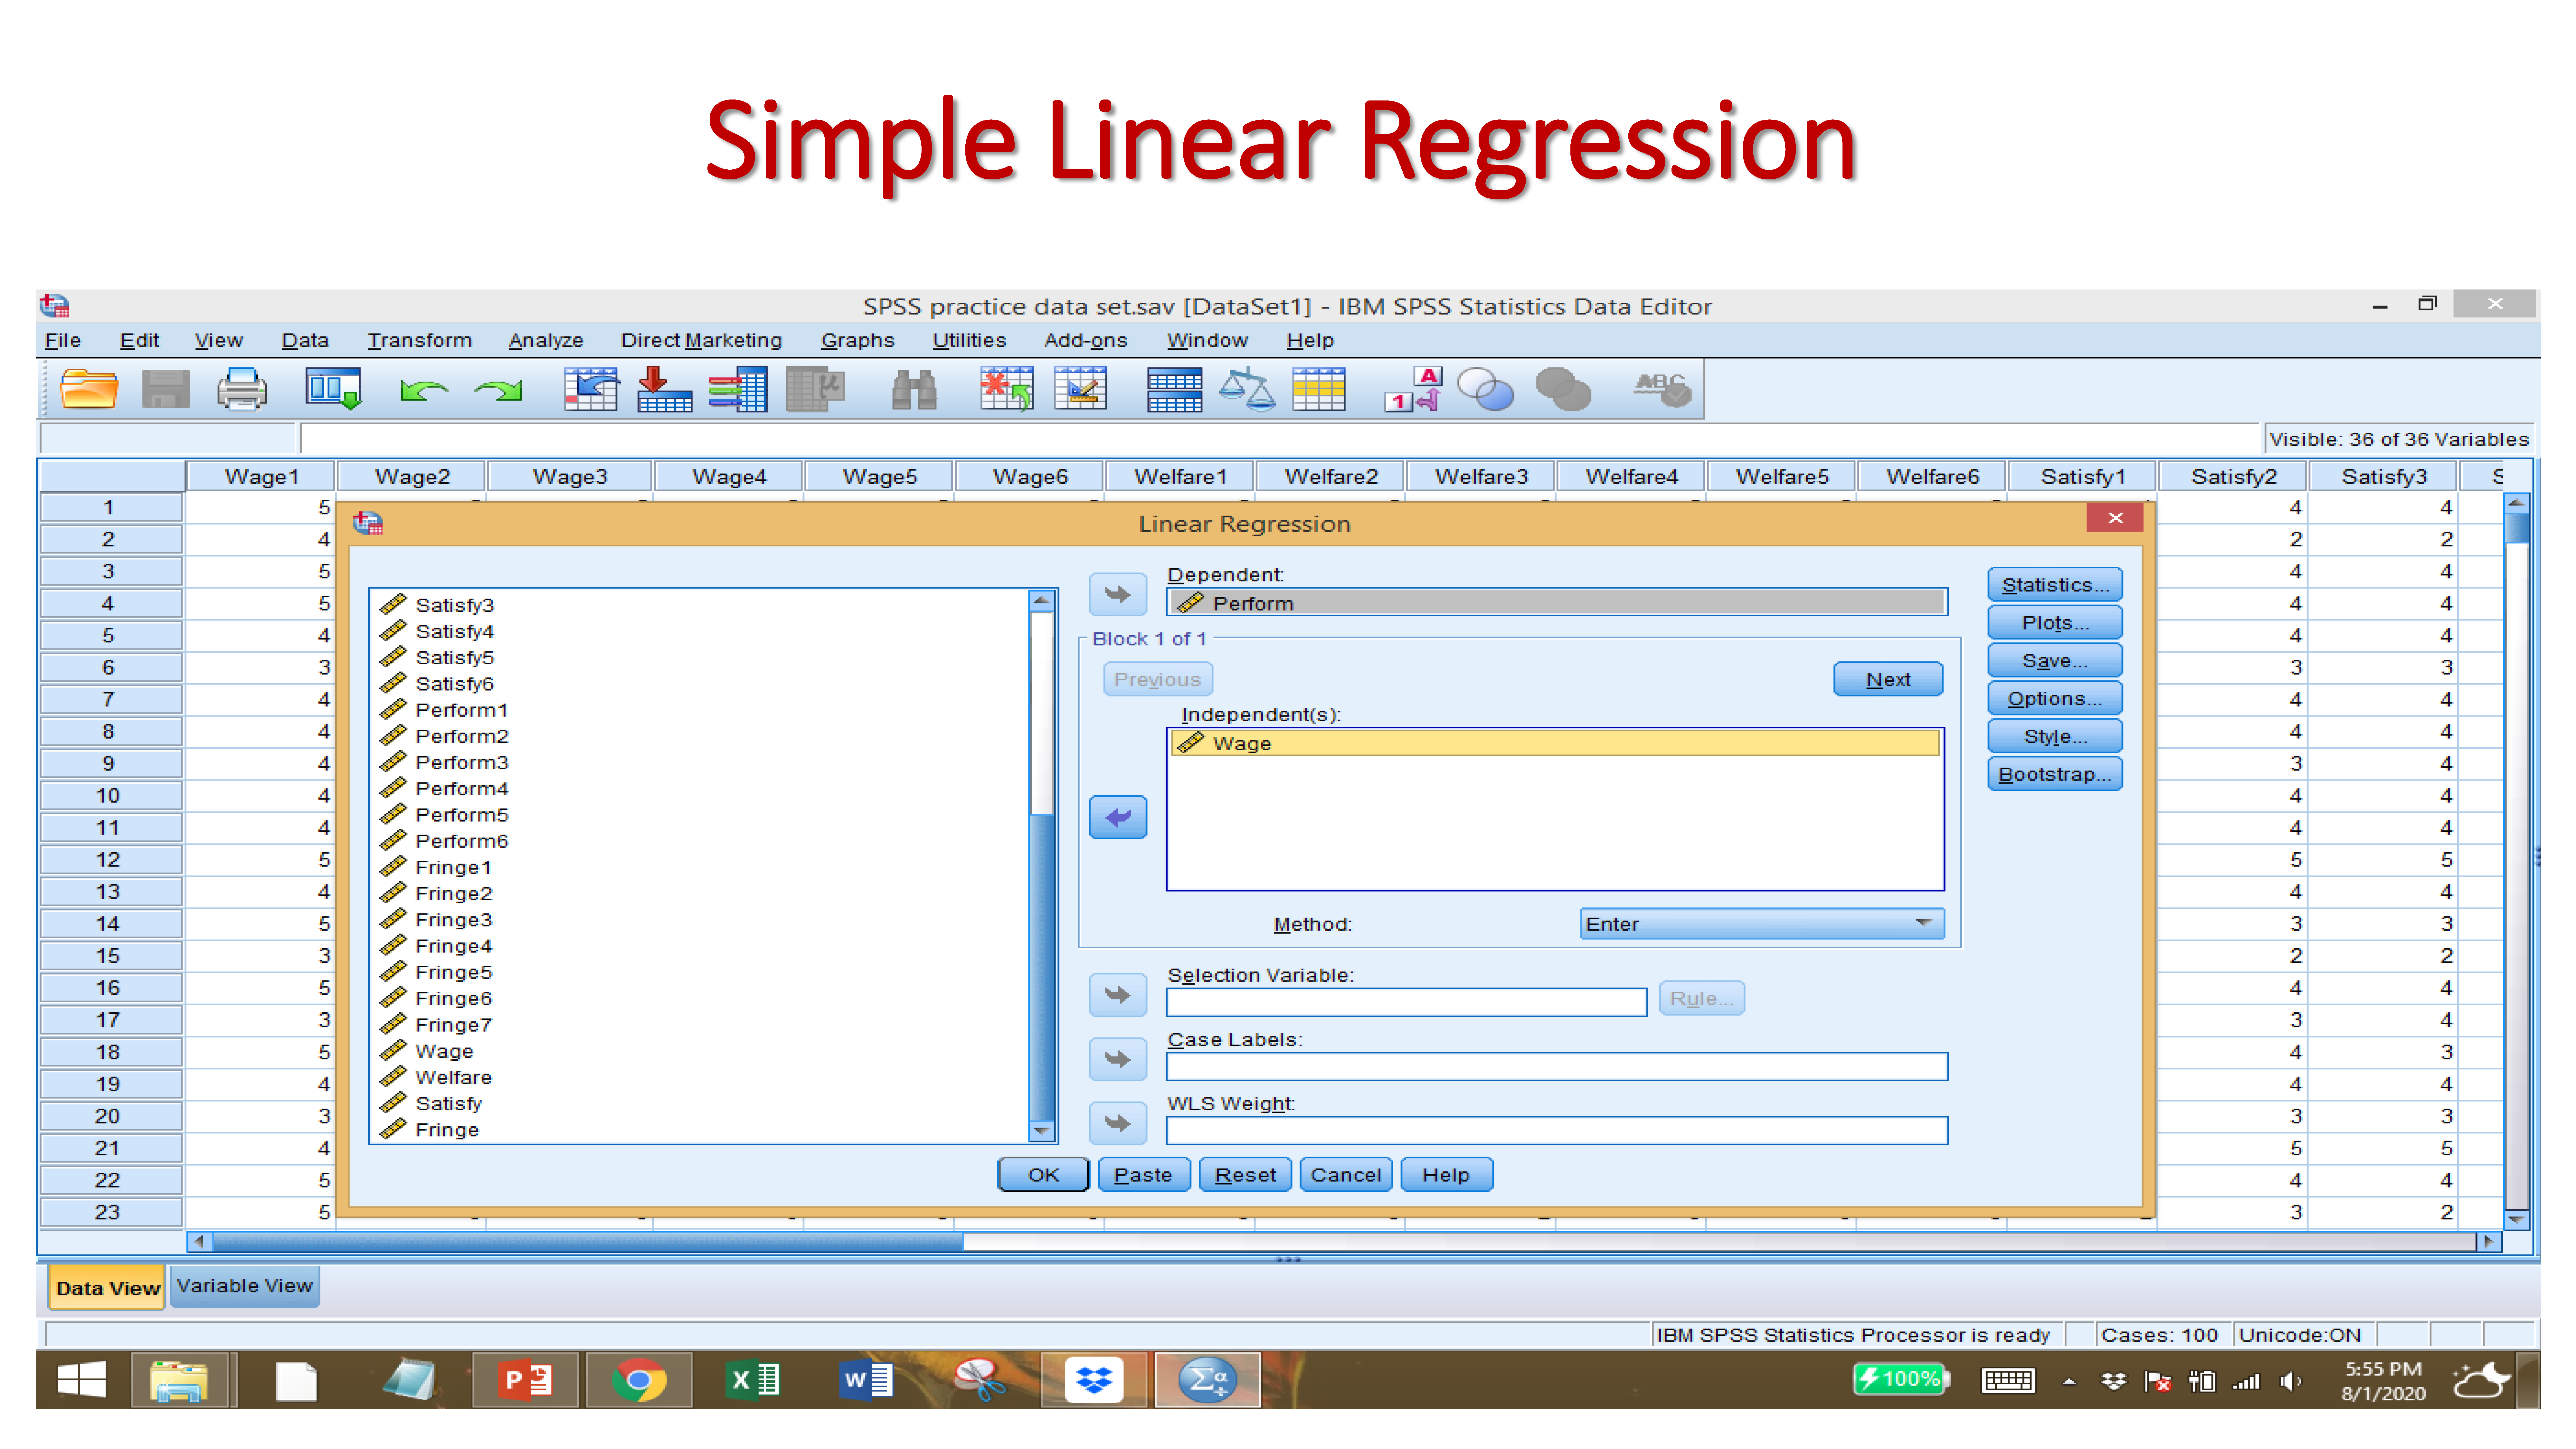
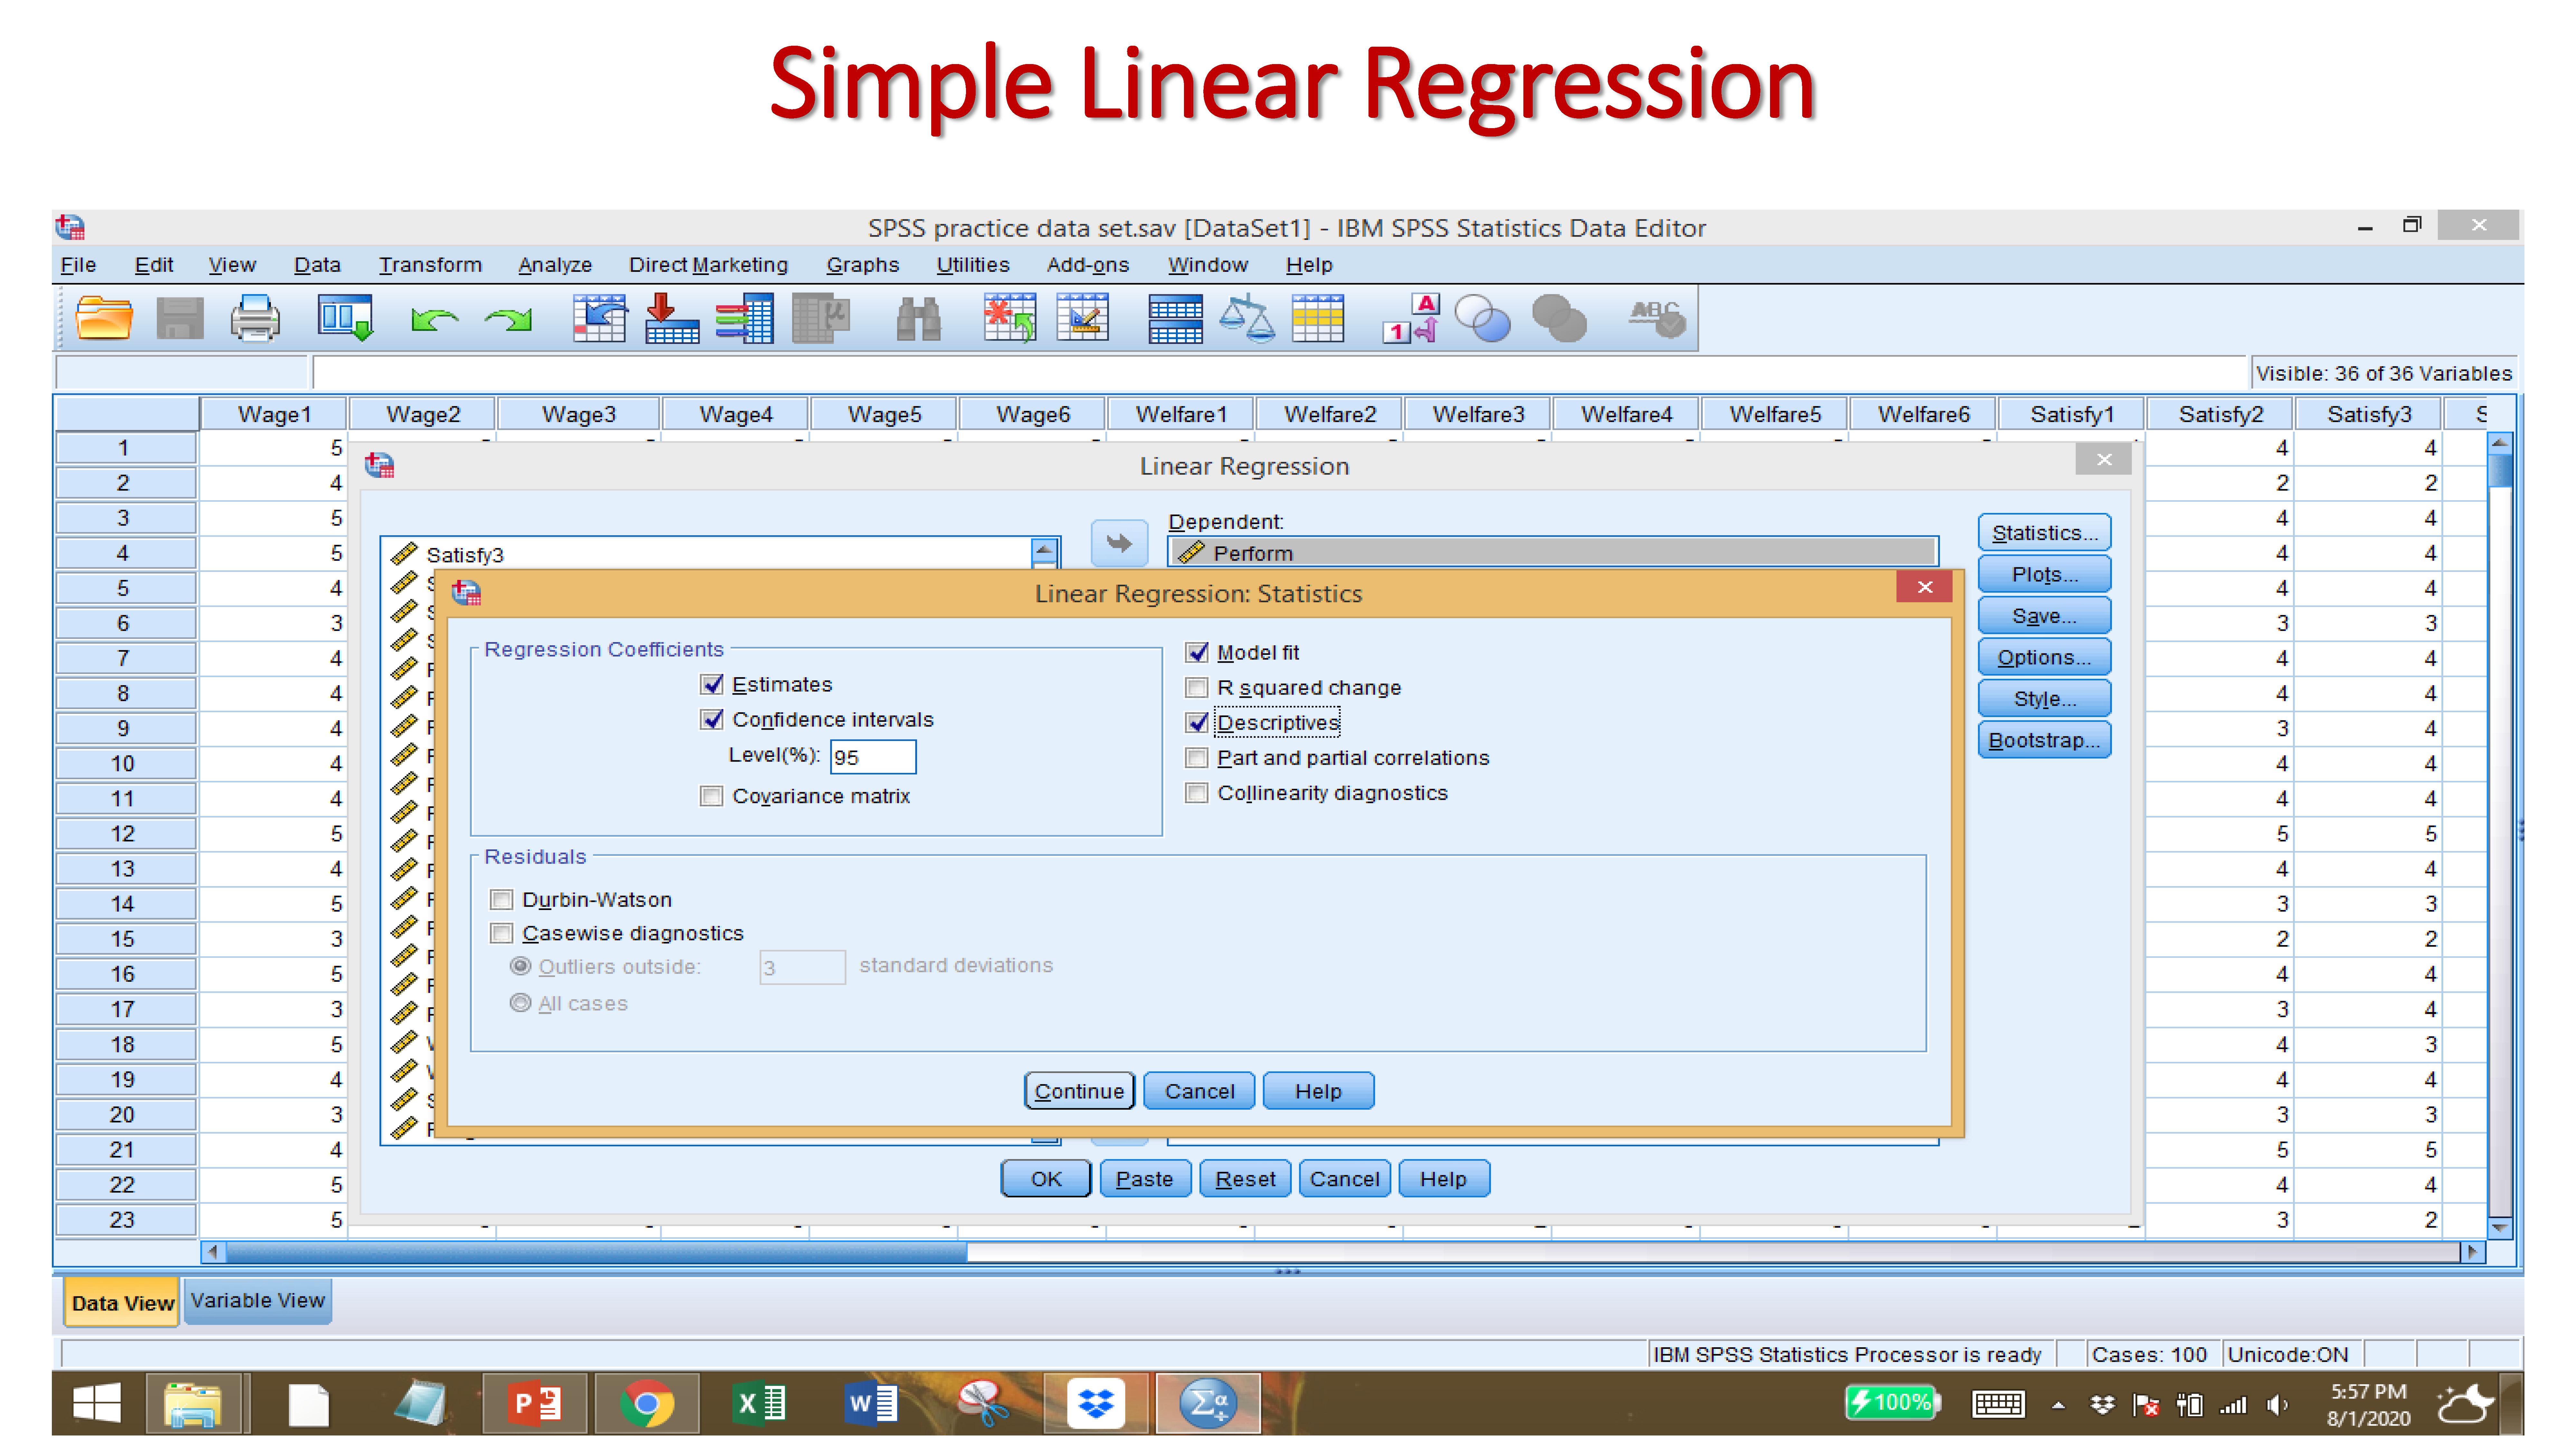
- Linear regression models are used to show or predict the relationship between two variables or factors. The factor that is being predicted (the factor that the equation solves for) is called the dependent variable. The factors that are used to predict the value of the dependent variable are called the independent variables.
- The simplest form of a regression analysis uses one dependent variable and one independent variable.

H1: Wage has a significant effect on employee performance
H2: Welfare has a significant effect on employee performance
H3: Fringe benefits has a significant effect on employee performance
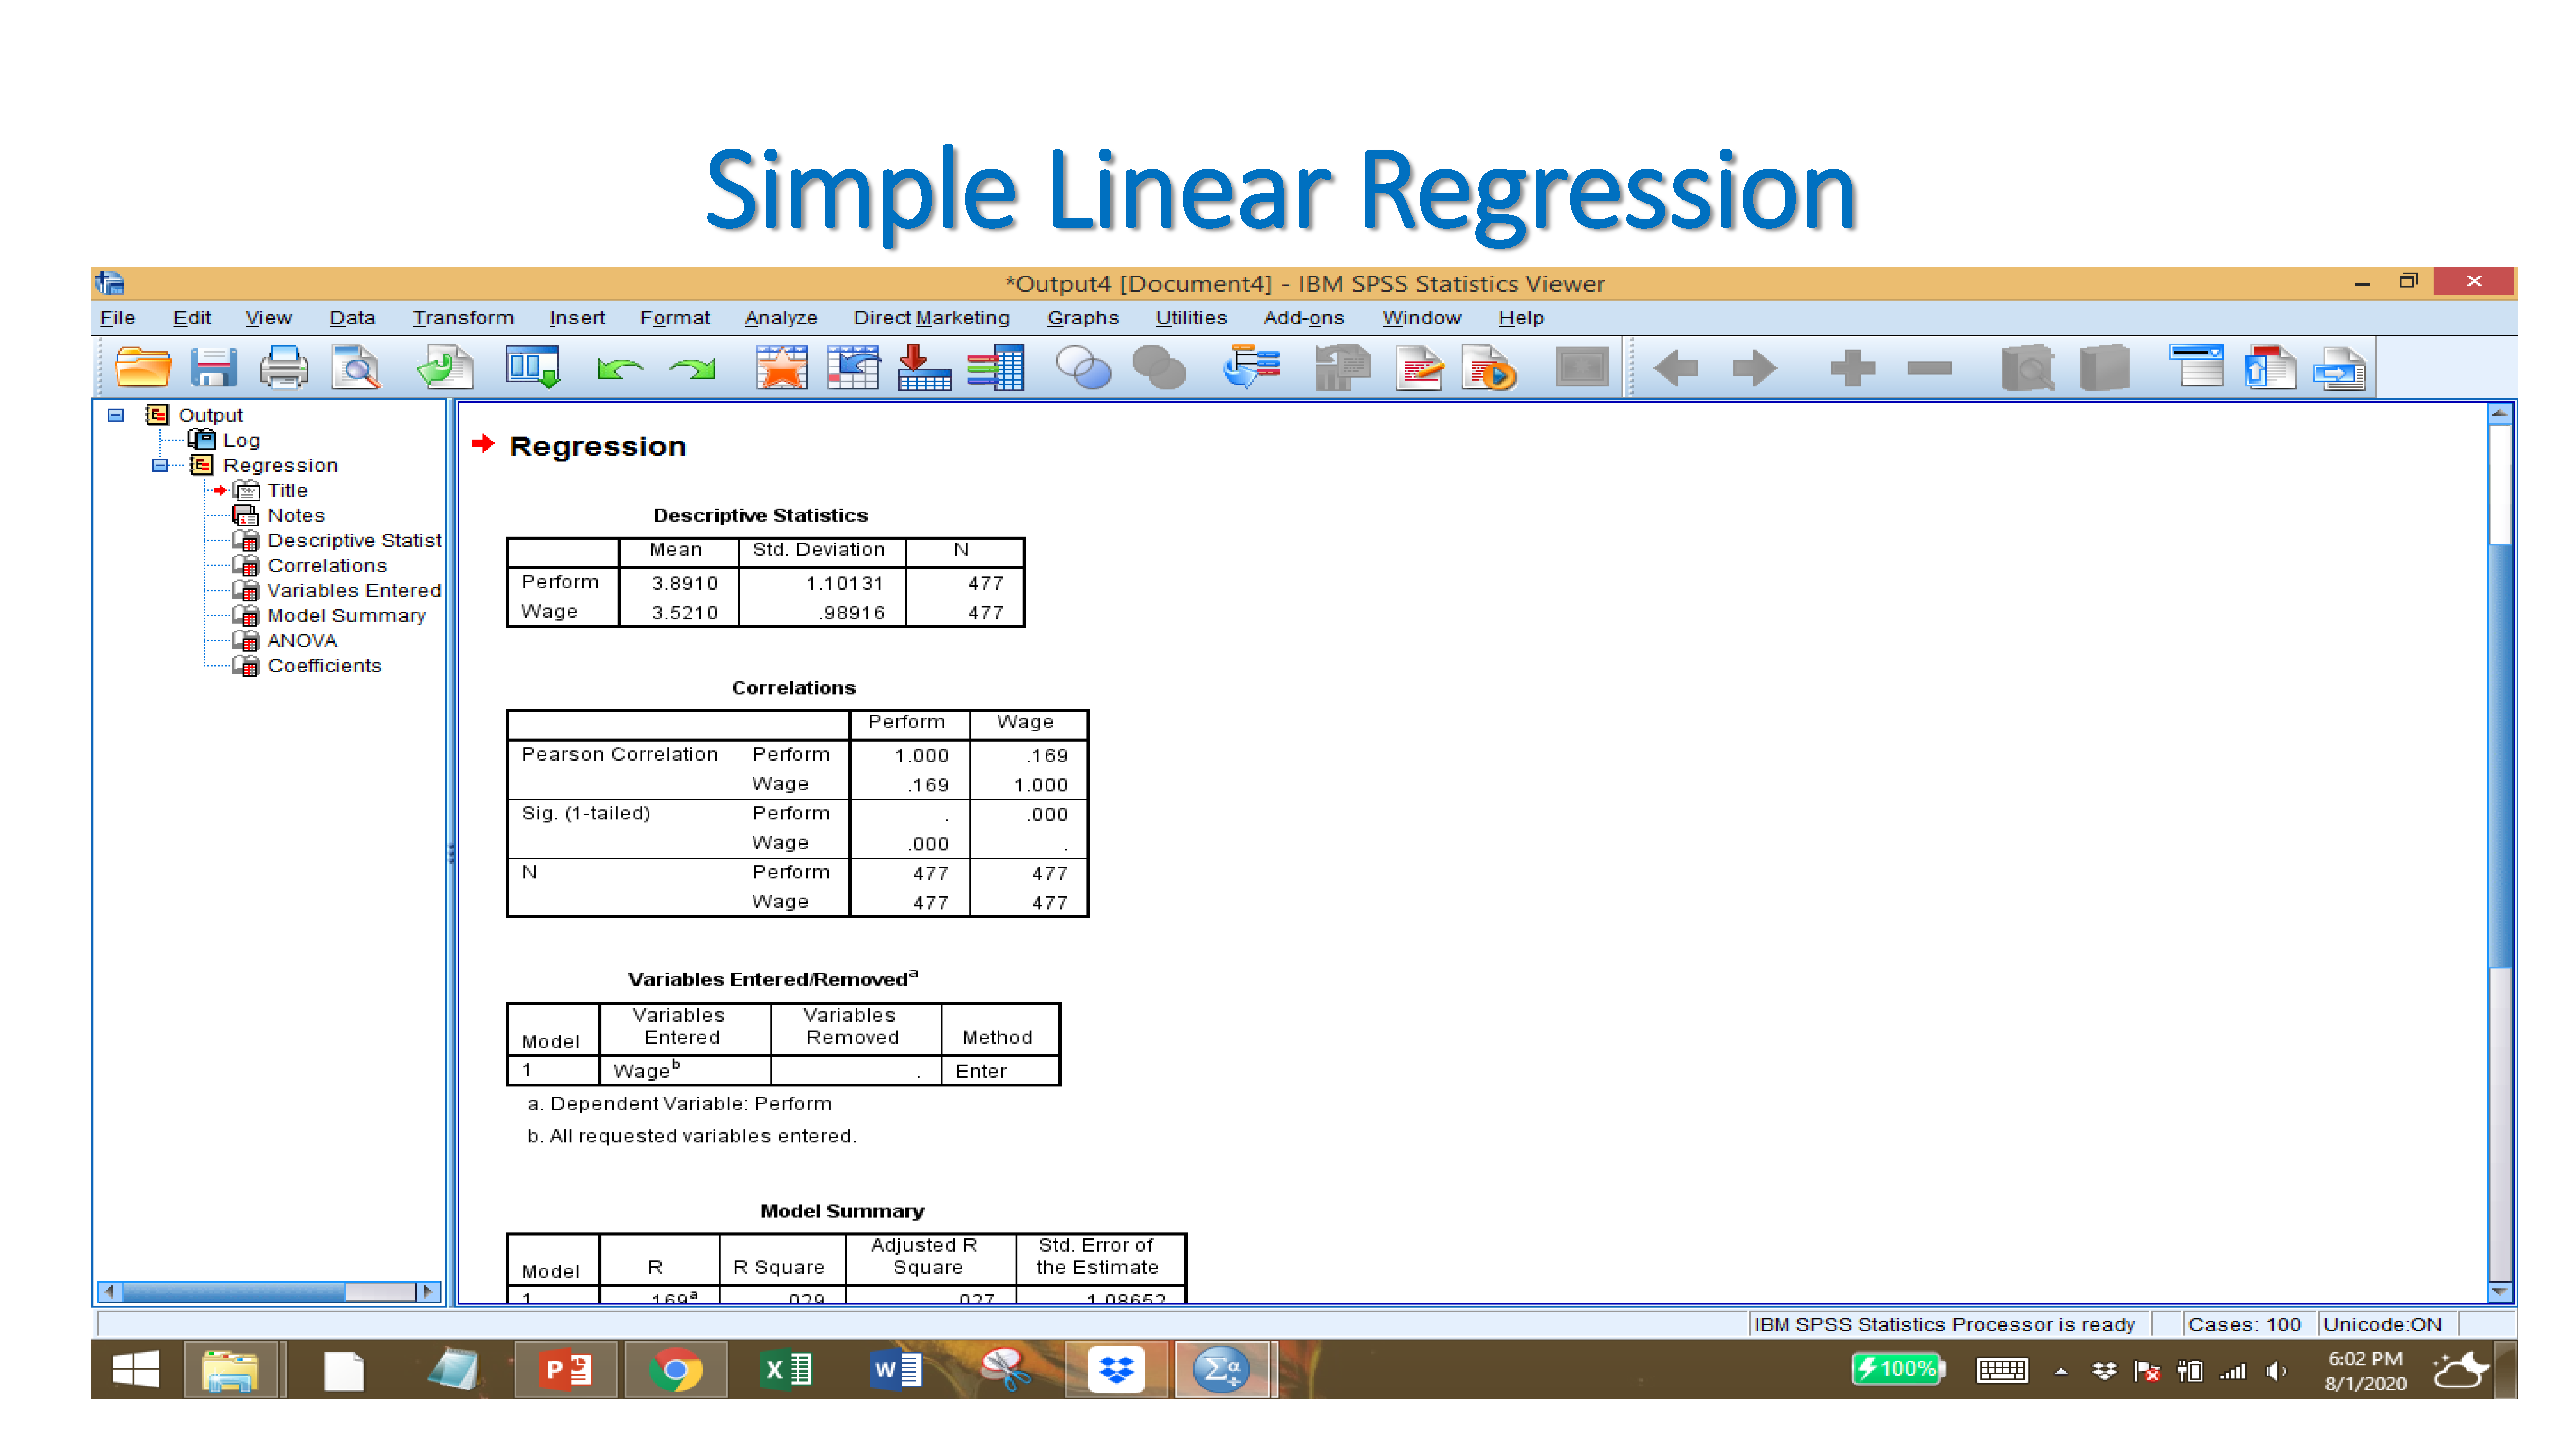
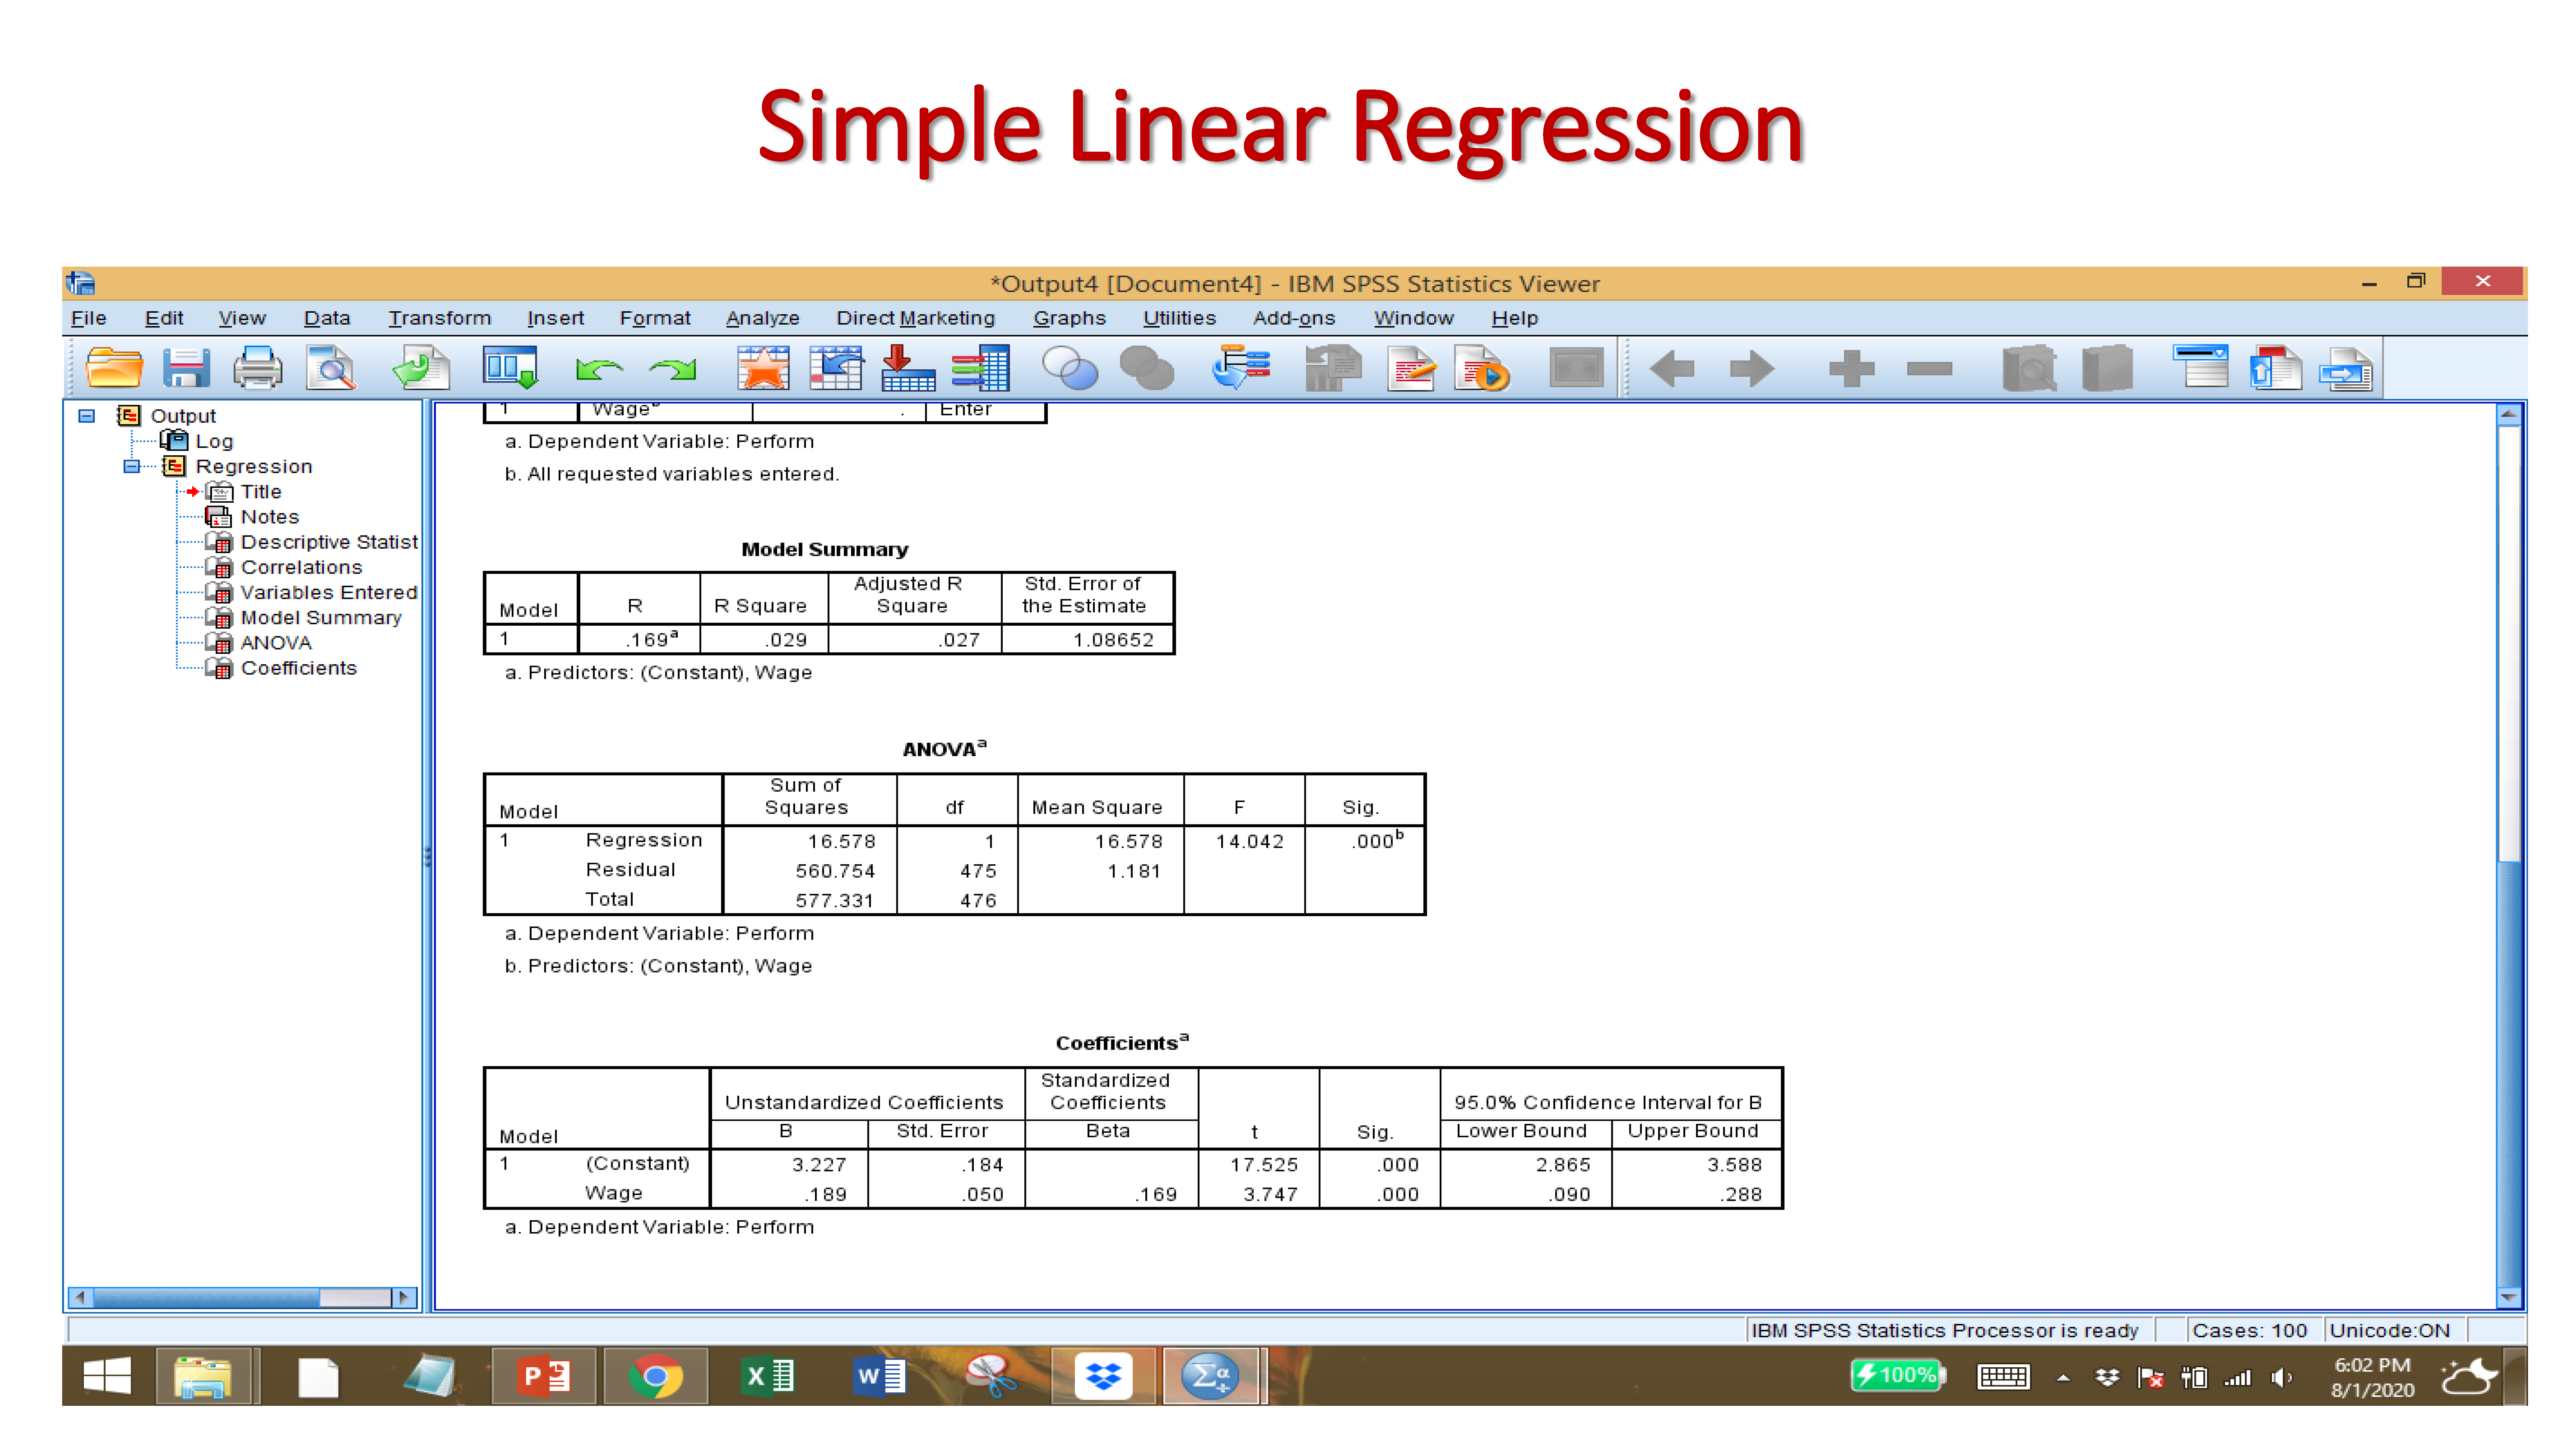
B-Value: Unstandardized coefficients are ‘raw’ coefficients produced by regression analysis when the analysis is performed on original, unstandardized variables. … An unstandardized coefficient represents the amount of change in a dependent variable Y due to a change of 1 unit of independent variable X.
Standard Error: The standard error of a statistic is the standard deviation of its sampling distribution or an estimate of that standard deviation. If the parameter or the statistic is the mean, it is called the standard error of the mean.
Beta: The beta values in regression are the estimated coefficients of the explanatory variables indicating a change on response variable caused by a unit change of respective explanatory variable keeping all the other explanatory variables constant/unchanged.
Significant t-value: The t-value measures the size of the difference relative to the variation in your sample data. Put another way, T is simply the calculated difference represented in units of standard error. The greater the magnitude of T, the greater the evidence against the null hypothesis. Null hypothesis is rejected if the t-value is more than or equal to 1.96 (two-tail) and 1.64 (one-tail)
Significant P-Value: The p-value for each term tests the null hypothesis that the coefficient is equal to zero (no effect). A low p-value (< 0.05) indicates that you can reject the null hypothesis.
Confidence interval: A 95% confidence interval is a range of values that you can be 95% certain contains the true mean of the population.
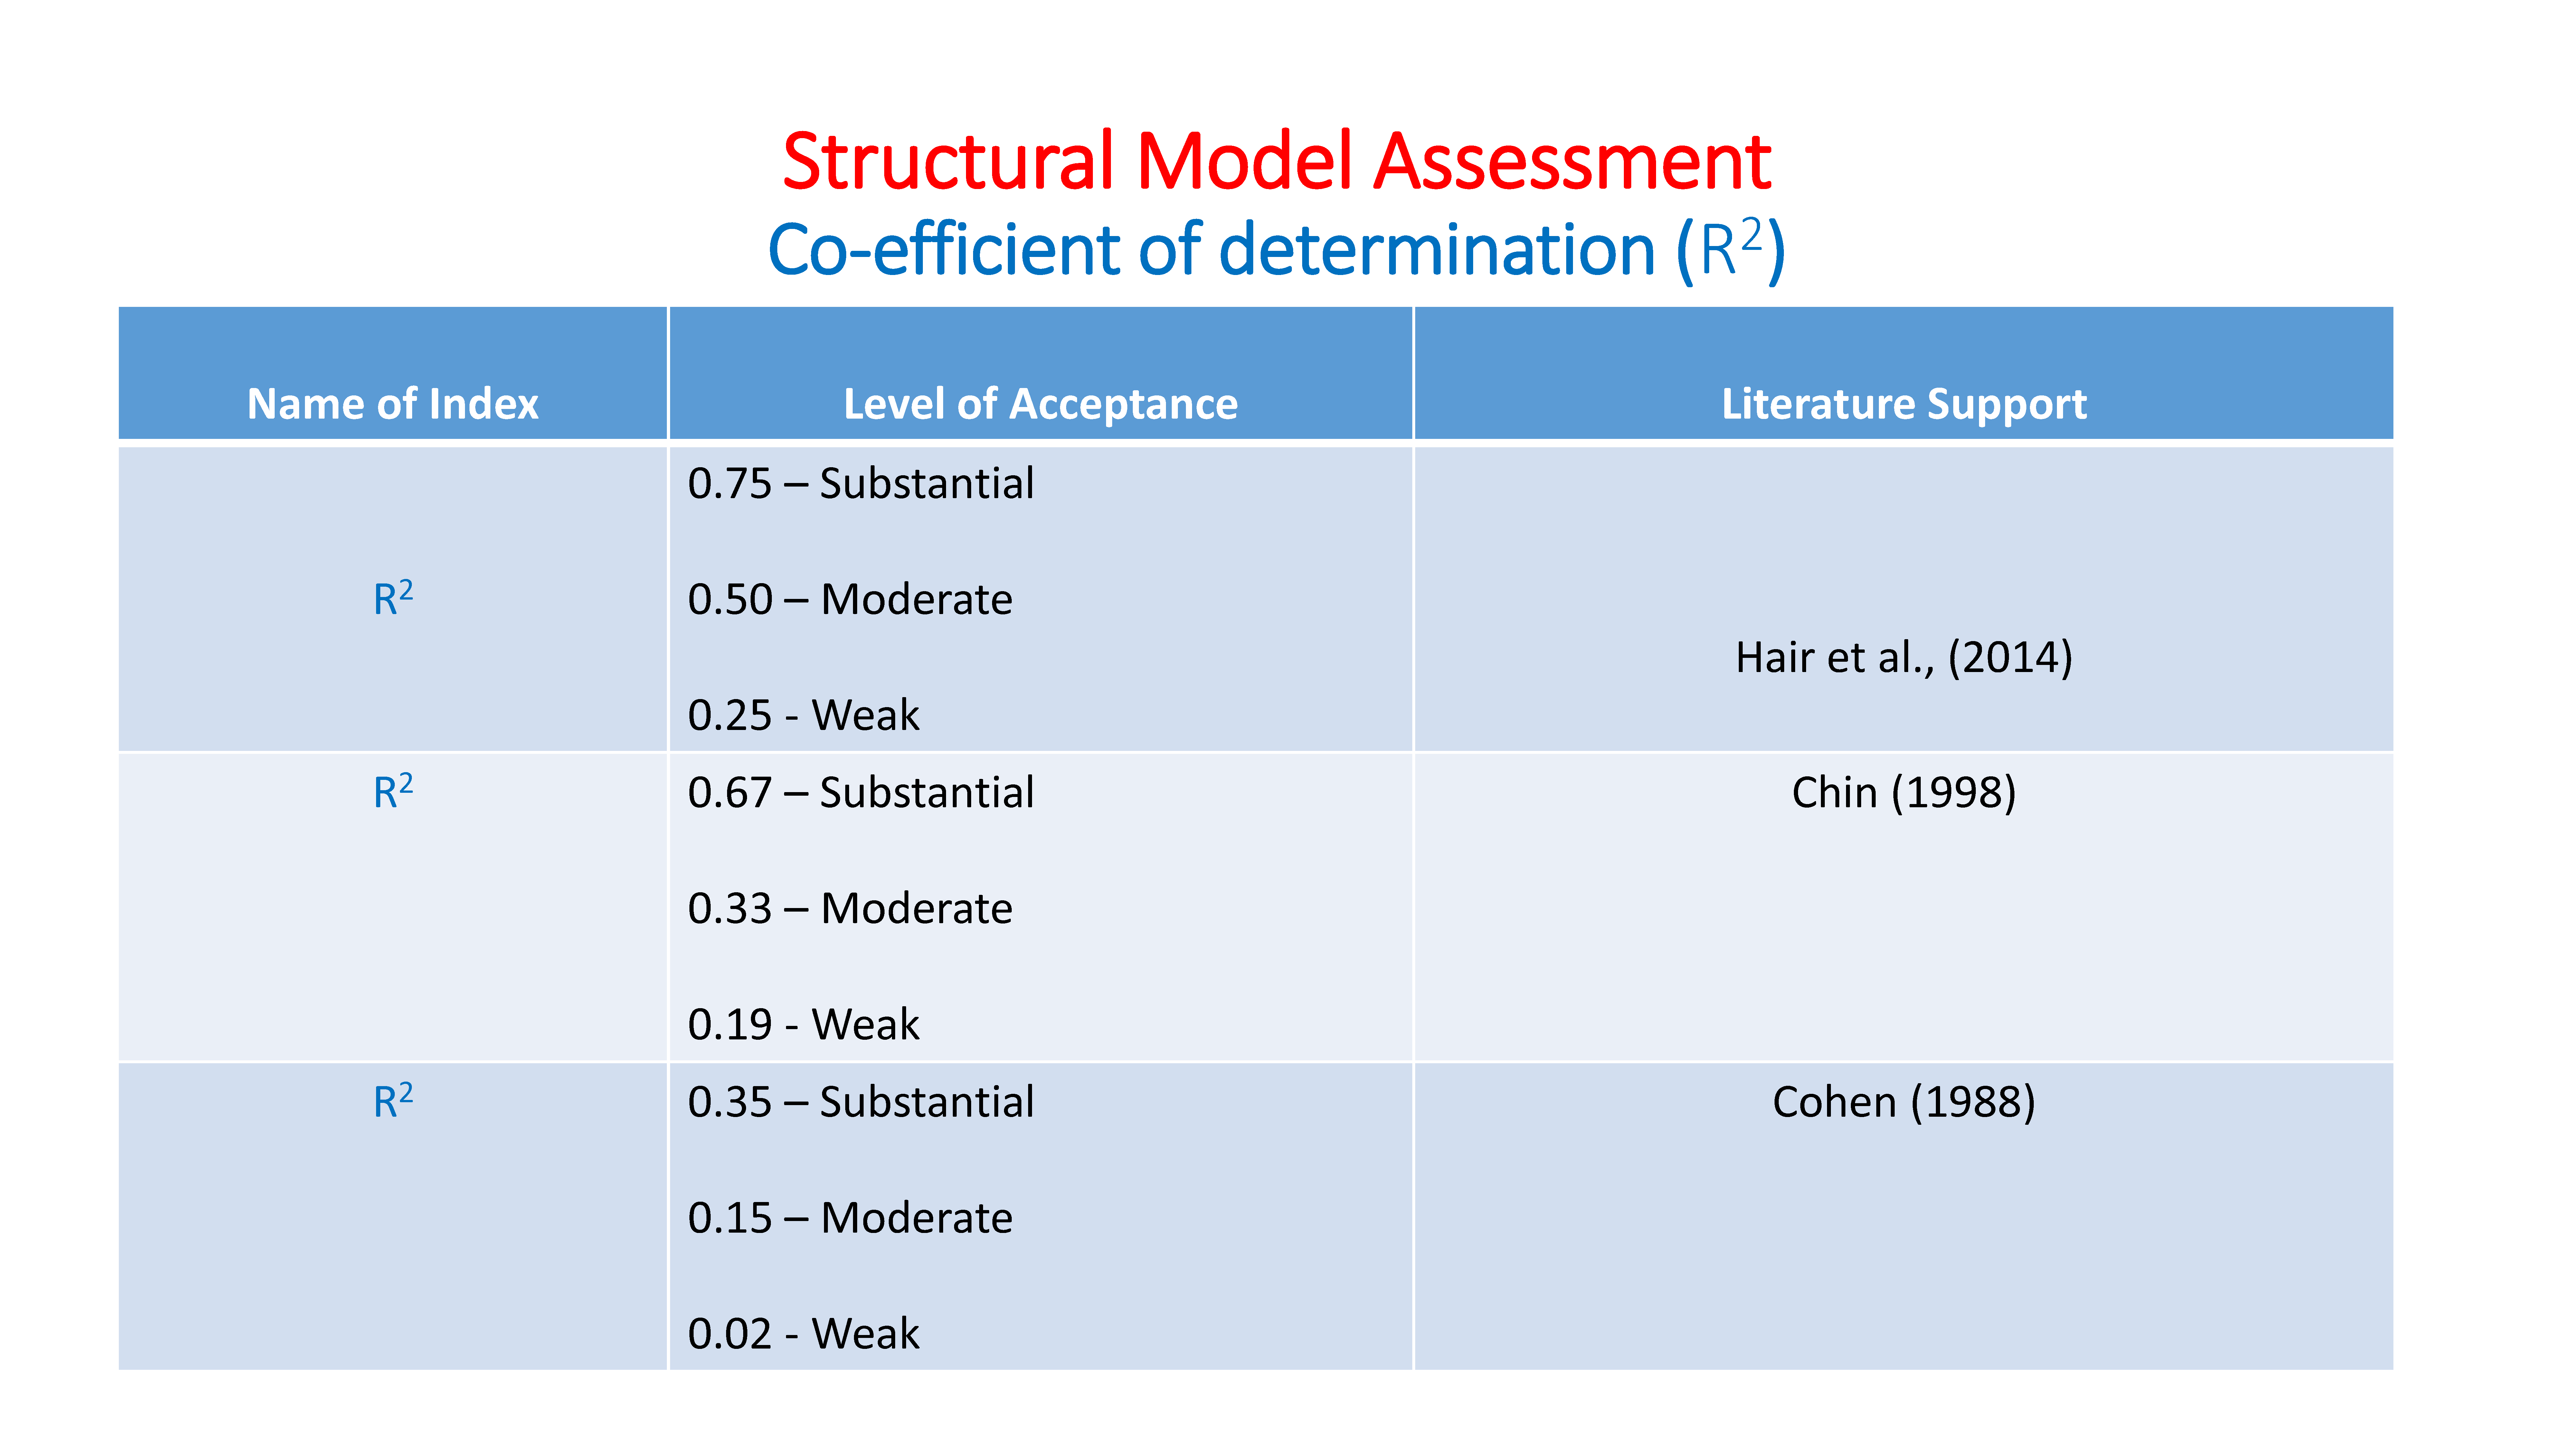
R-squared: R-squared is a statistical measure of how close the data are to the fitted regression line. It is also known as the coefficient of determination, or the coefficient of multiple determination for multiple regression. … 100% indicates that the model explains all the variability of the response data around its mean.
Adjusted R-squared: The adjusted R-squared is a modified version of R-squared that has been adjusted for the number of predictors in the model. The adjusted R-squared increases only if the new term improves the model more than would be expected by chance. It decreases when a predictor improves the model by less than expected by chance.
11.2 Multiple Linear Regression
Multiple linear regression (MLR), also known simply as multiple regression, is a statistical technique that uses several explanatory variables to predict the outcome of a response variable.

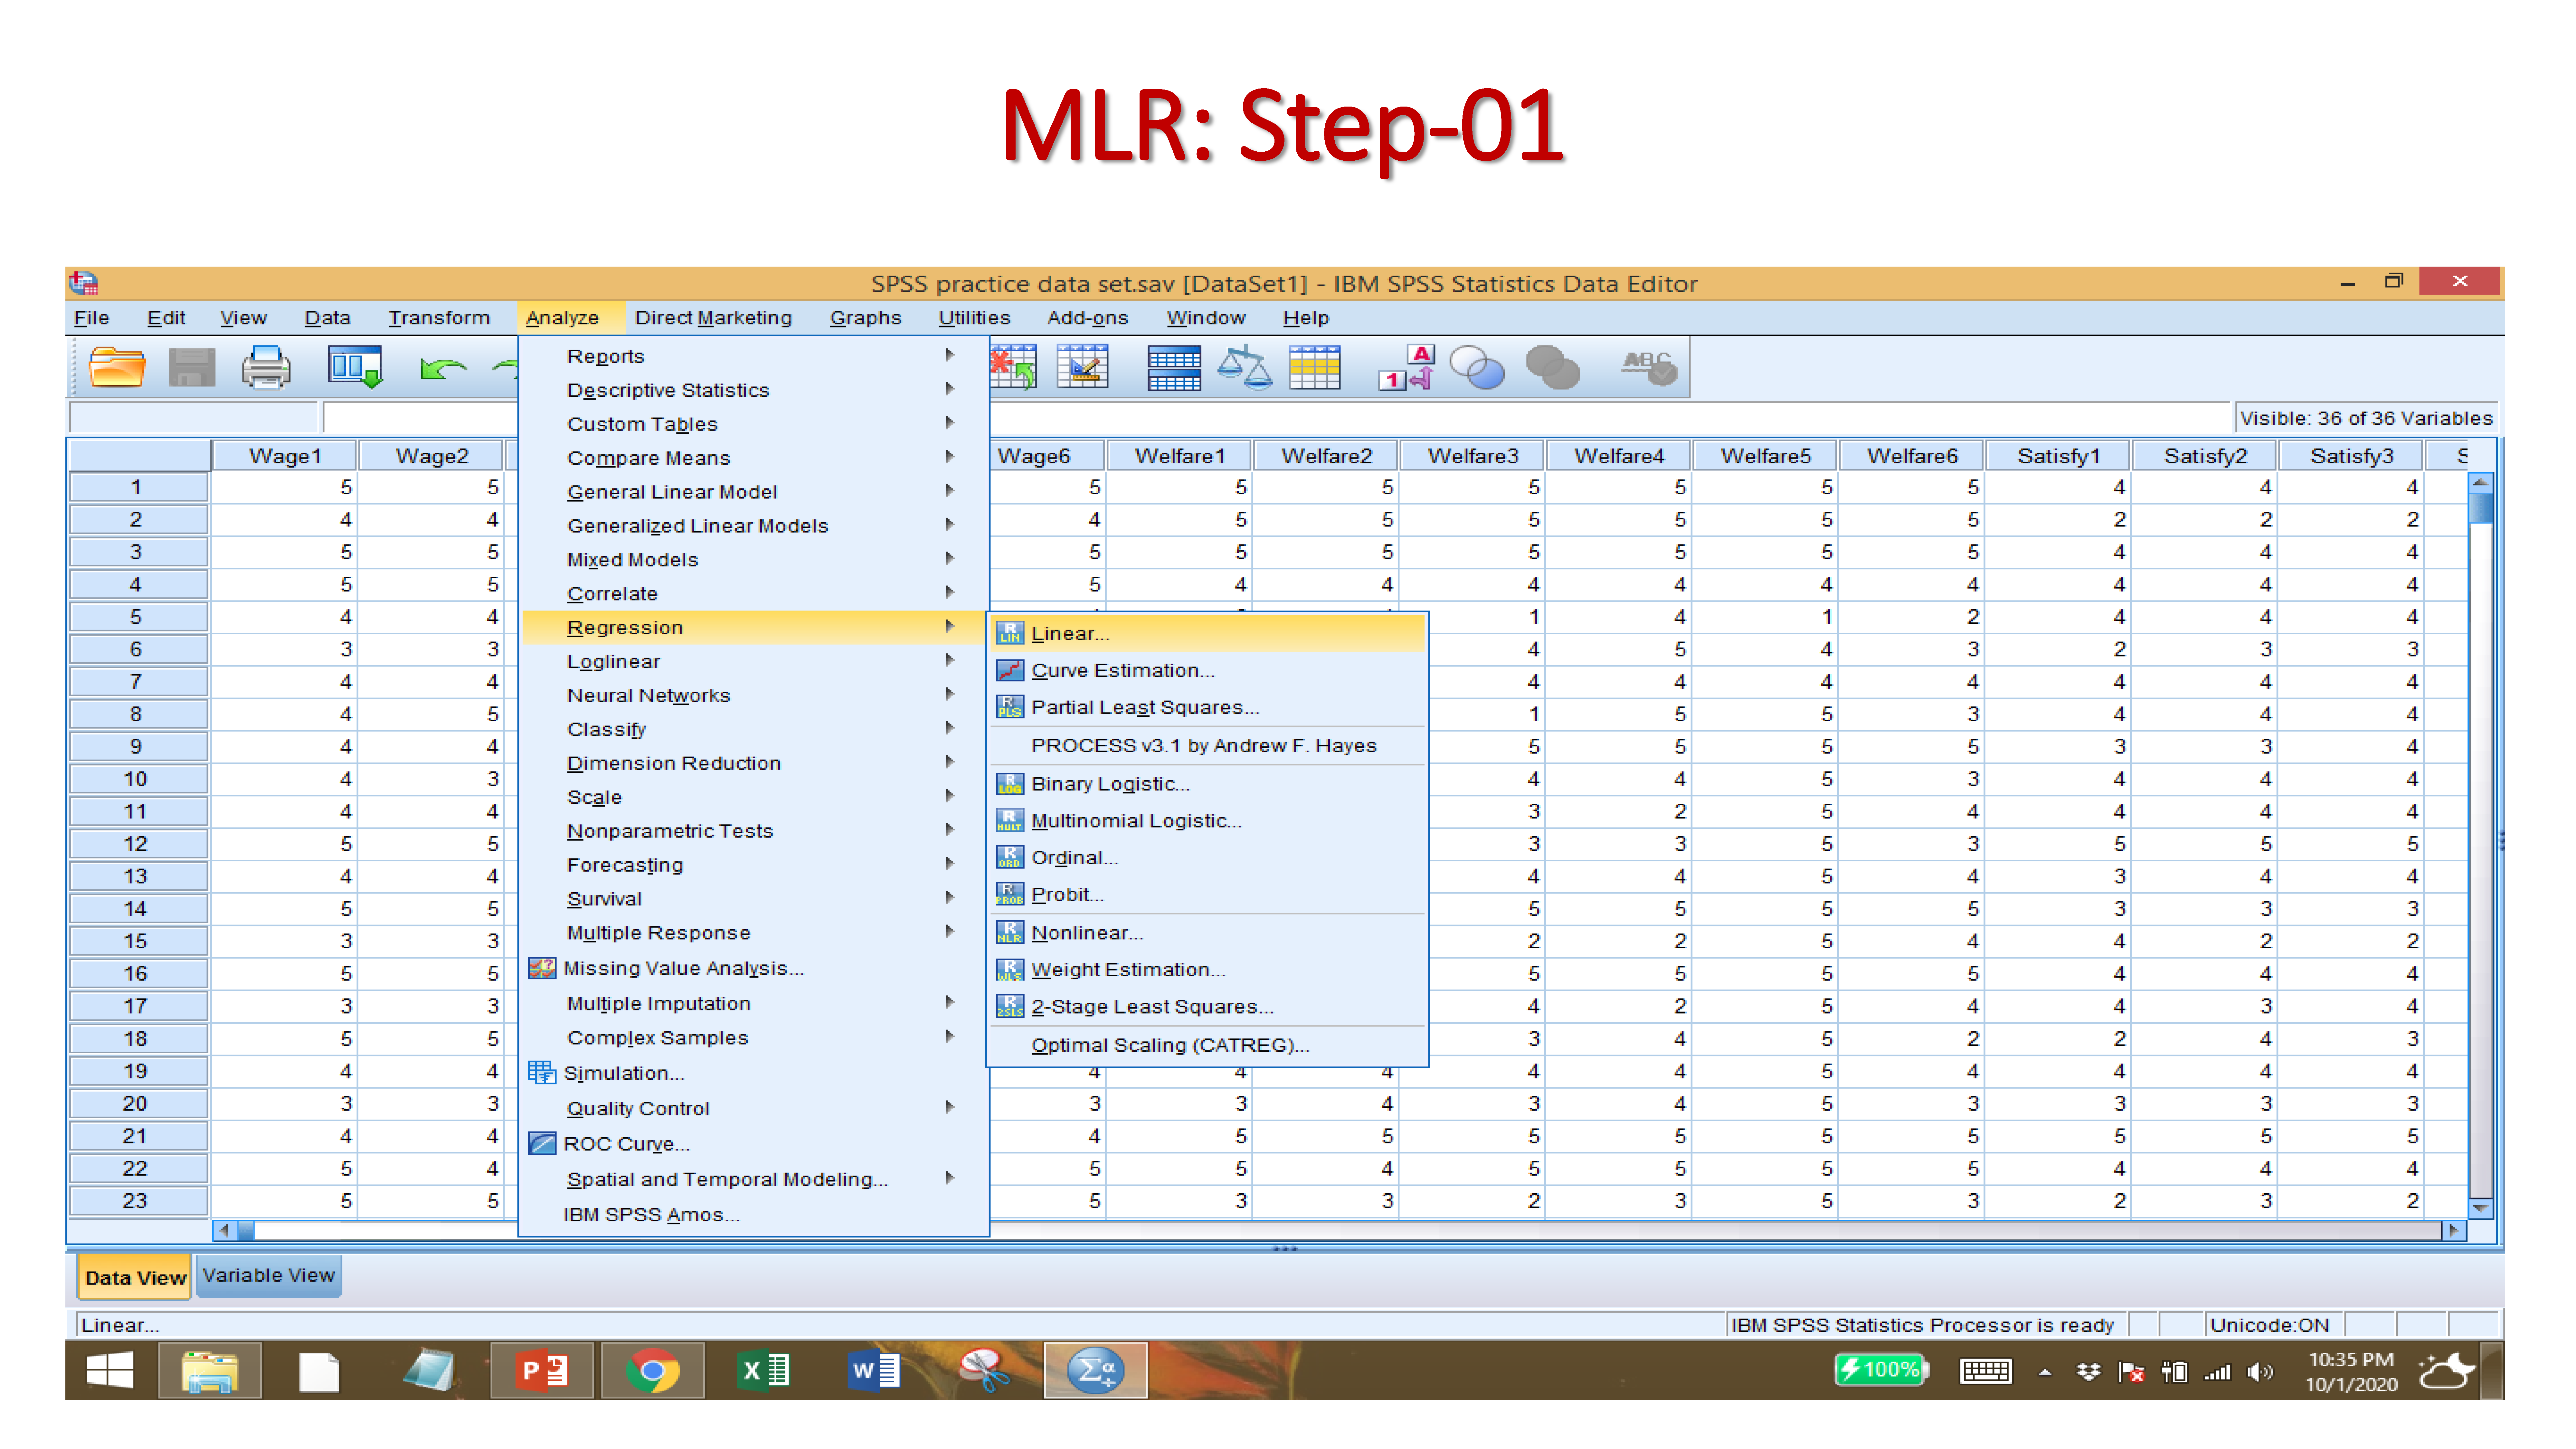
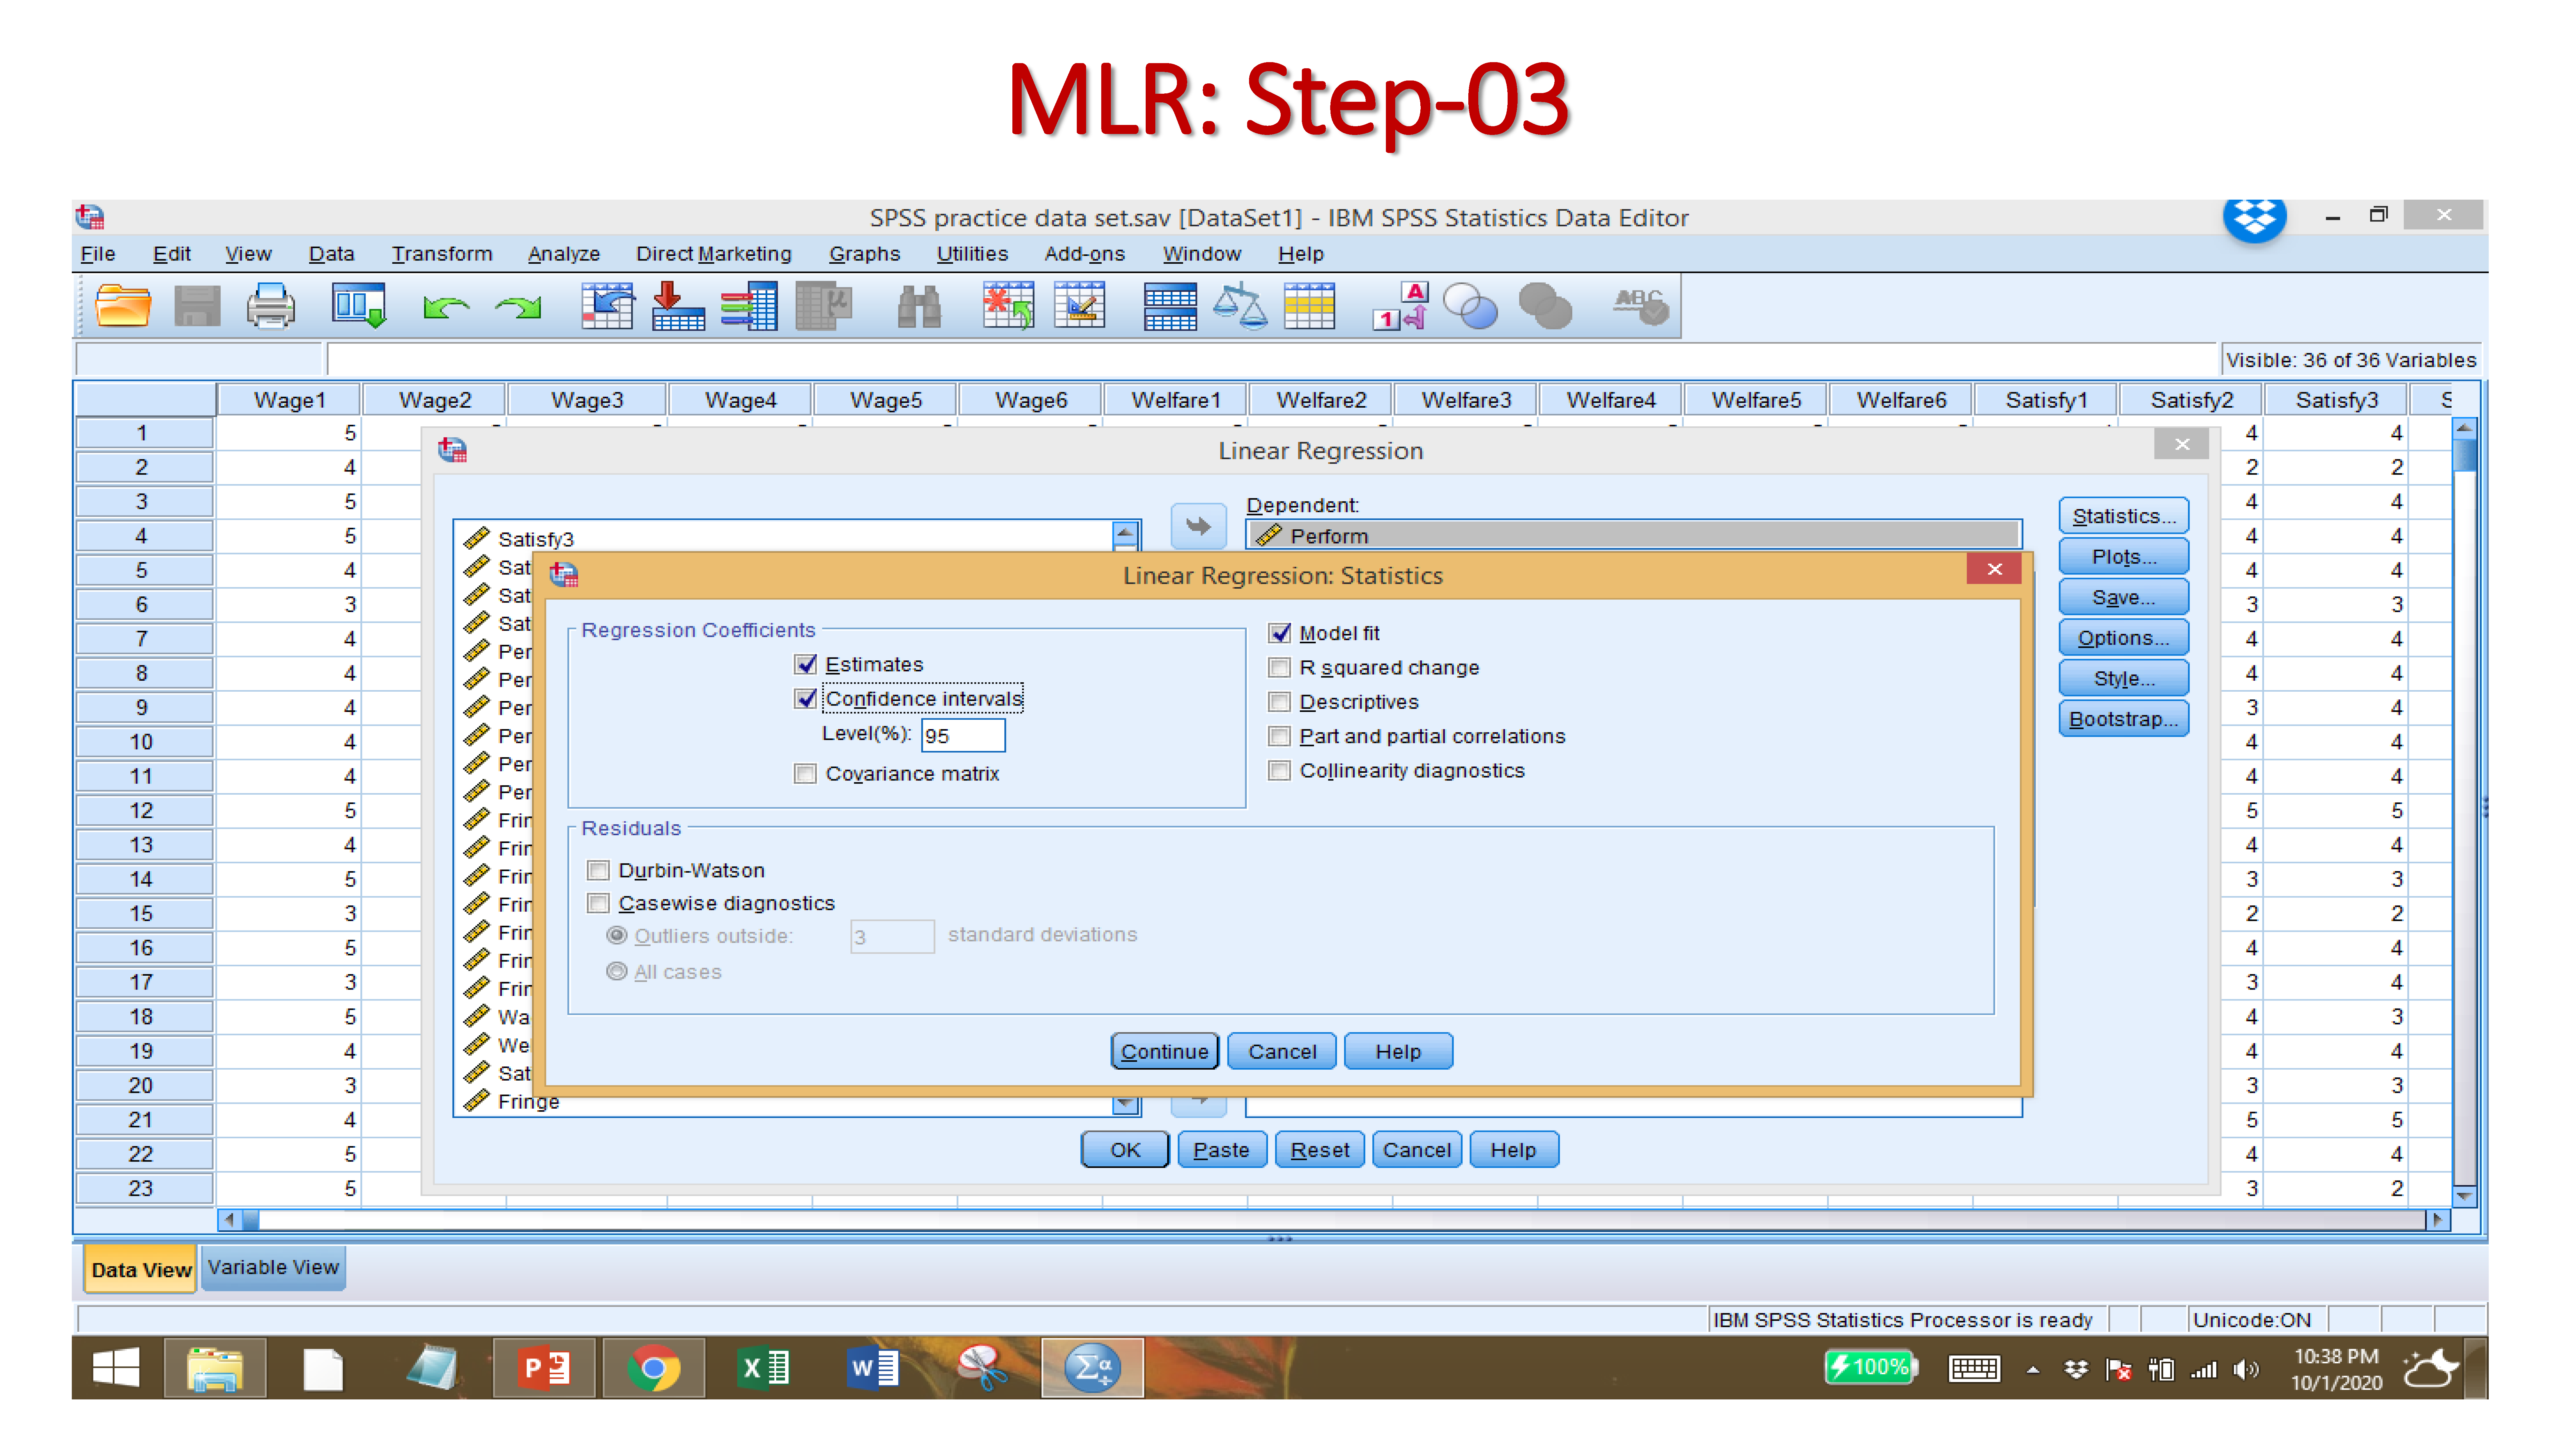
After Importing your data set, and providing names to variables, click on:
ANALYZE → REGRESSION → LINEAR
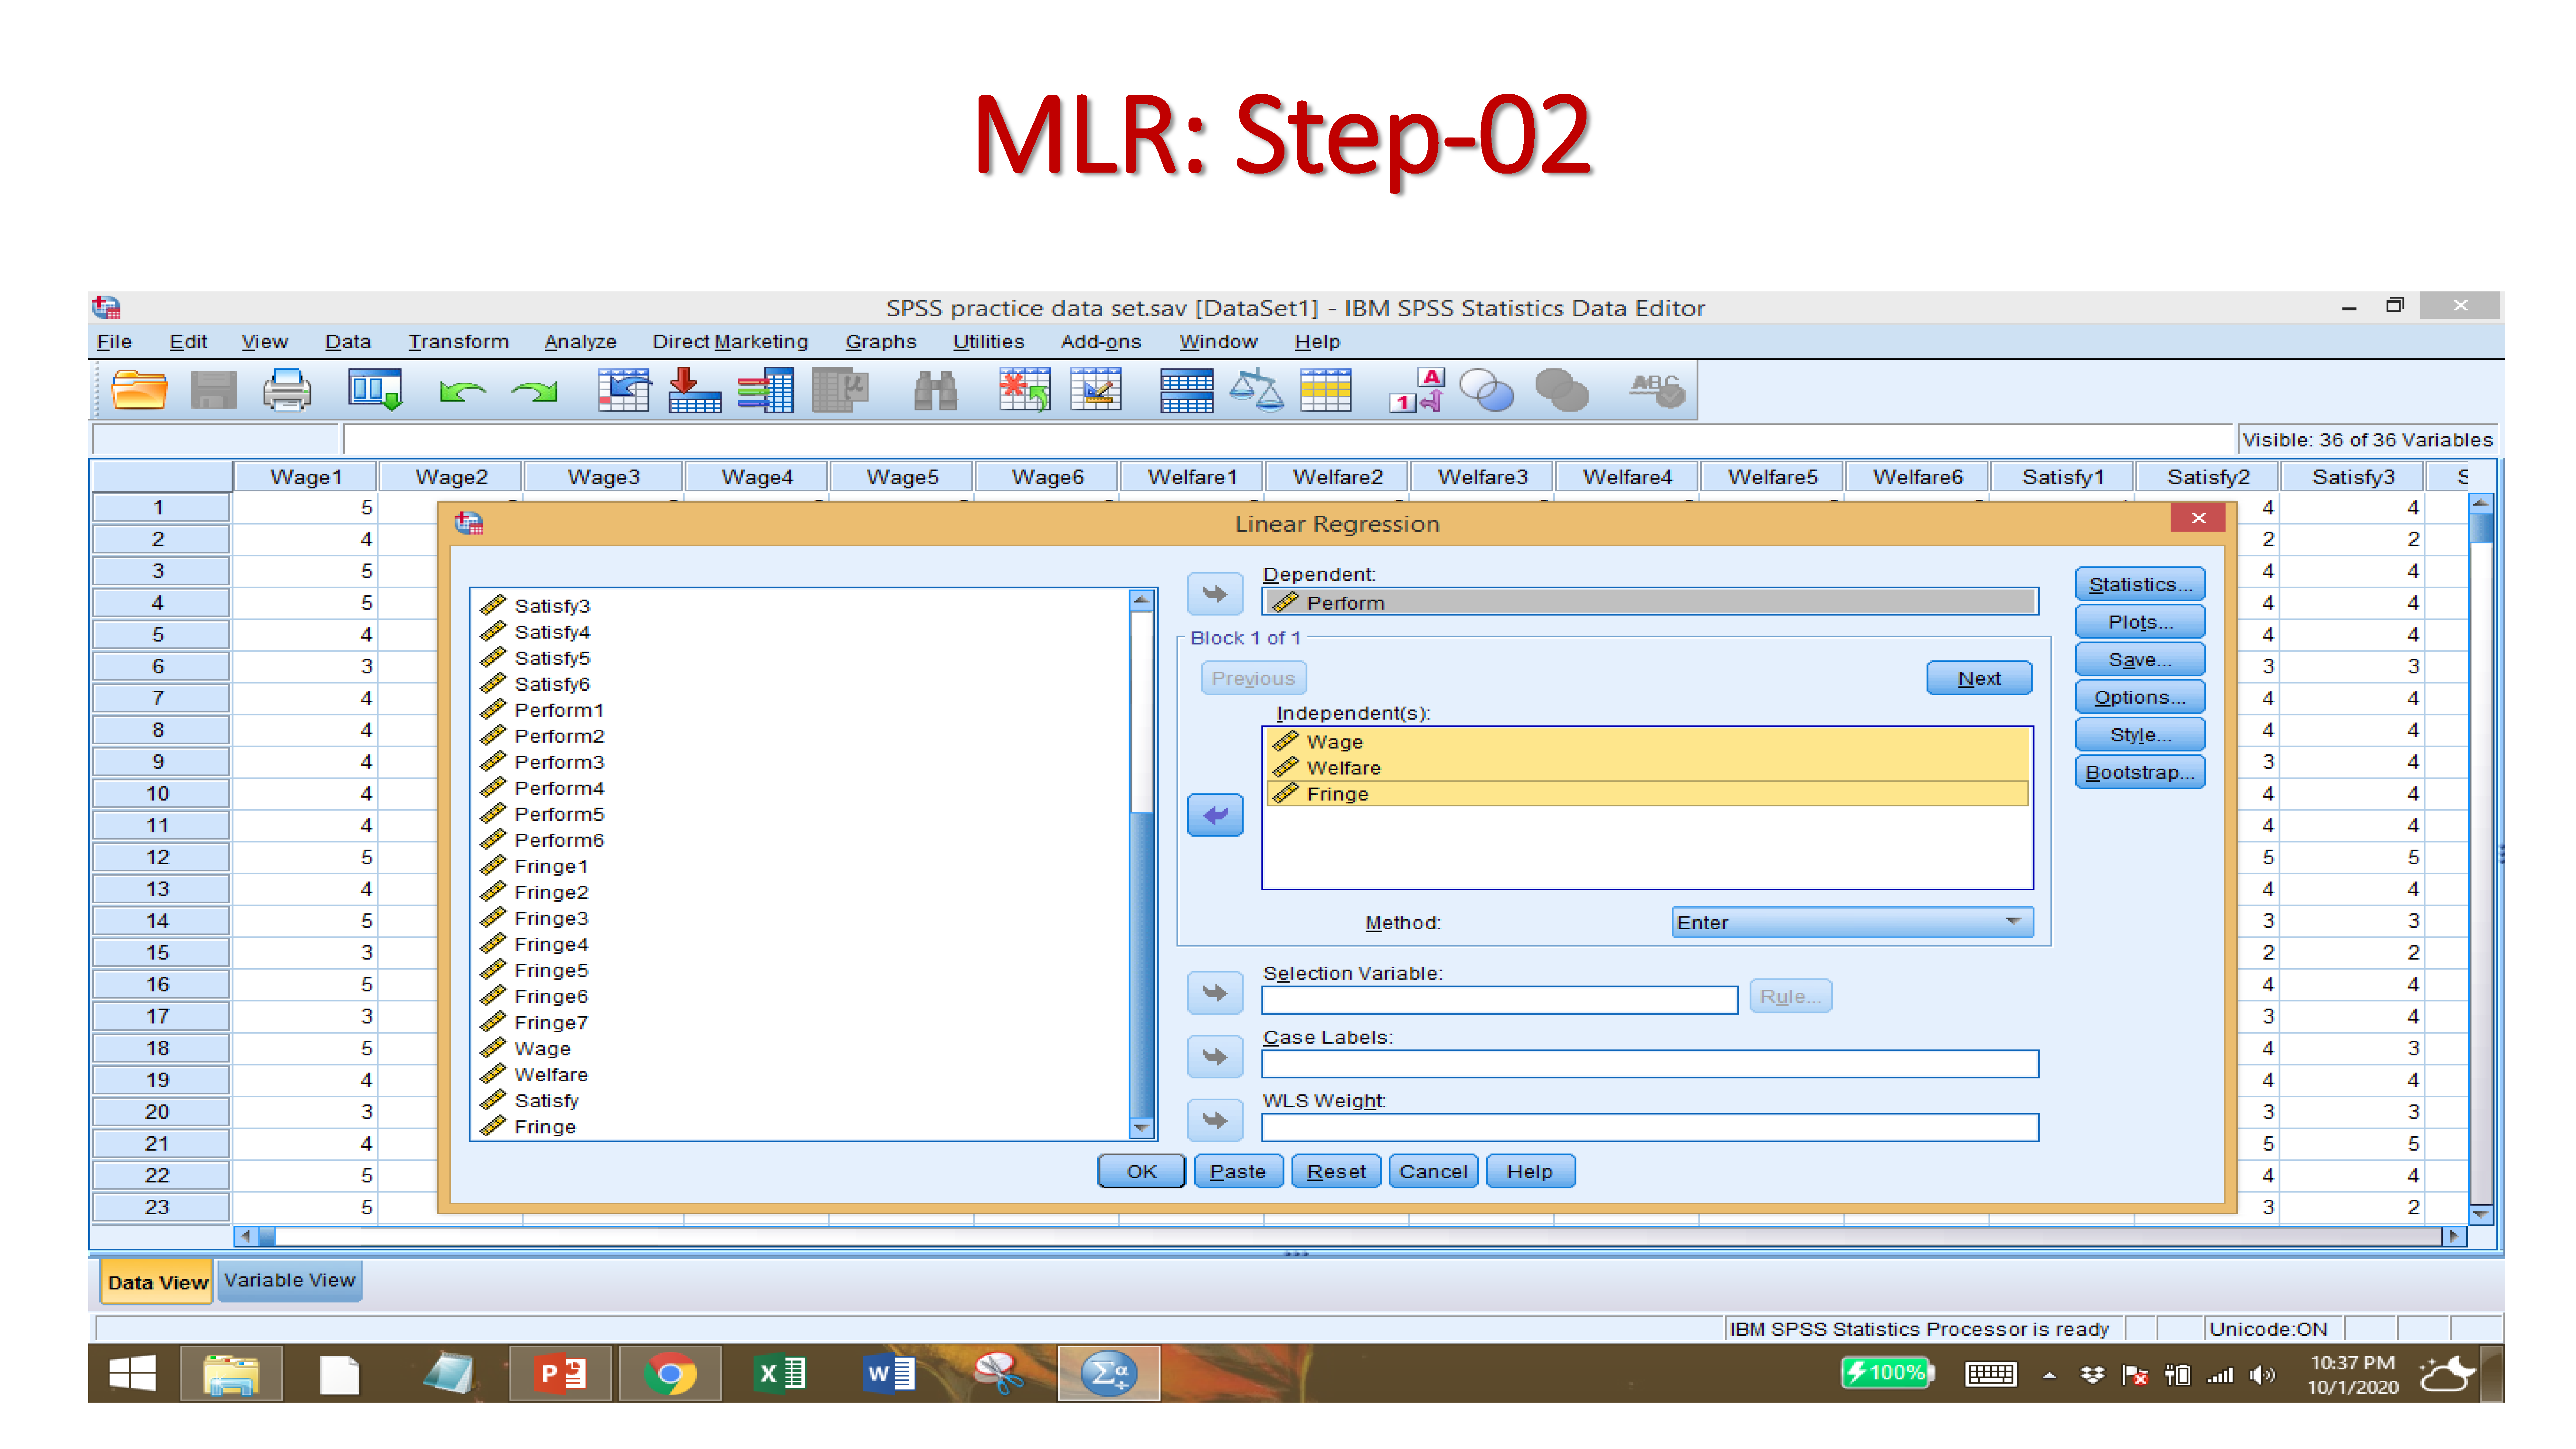
Select the DEPENDENT VARIABLE
Select the INDEPENDENT VARAIABLES
Click on STATISTICS, then ESTIMATES, CONFIDENCE INTERVALS, MODEL FIT
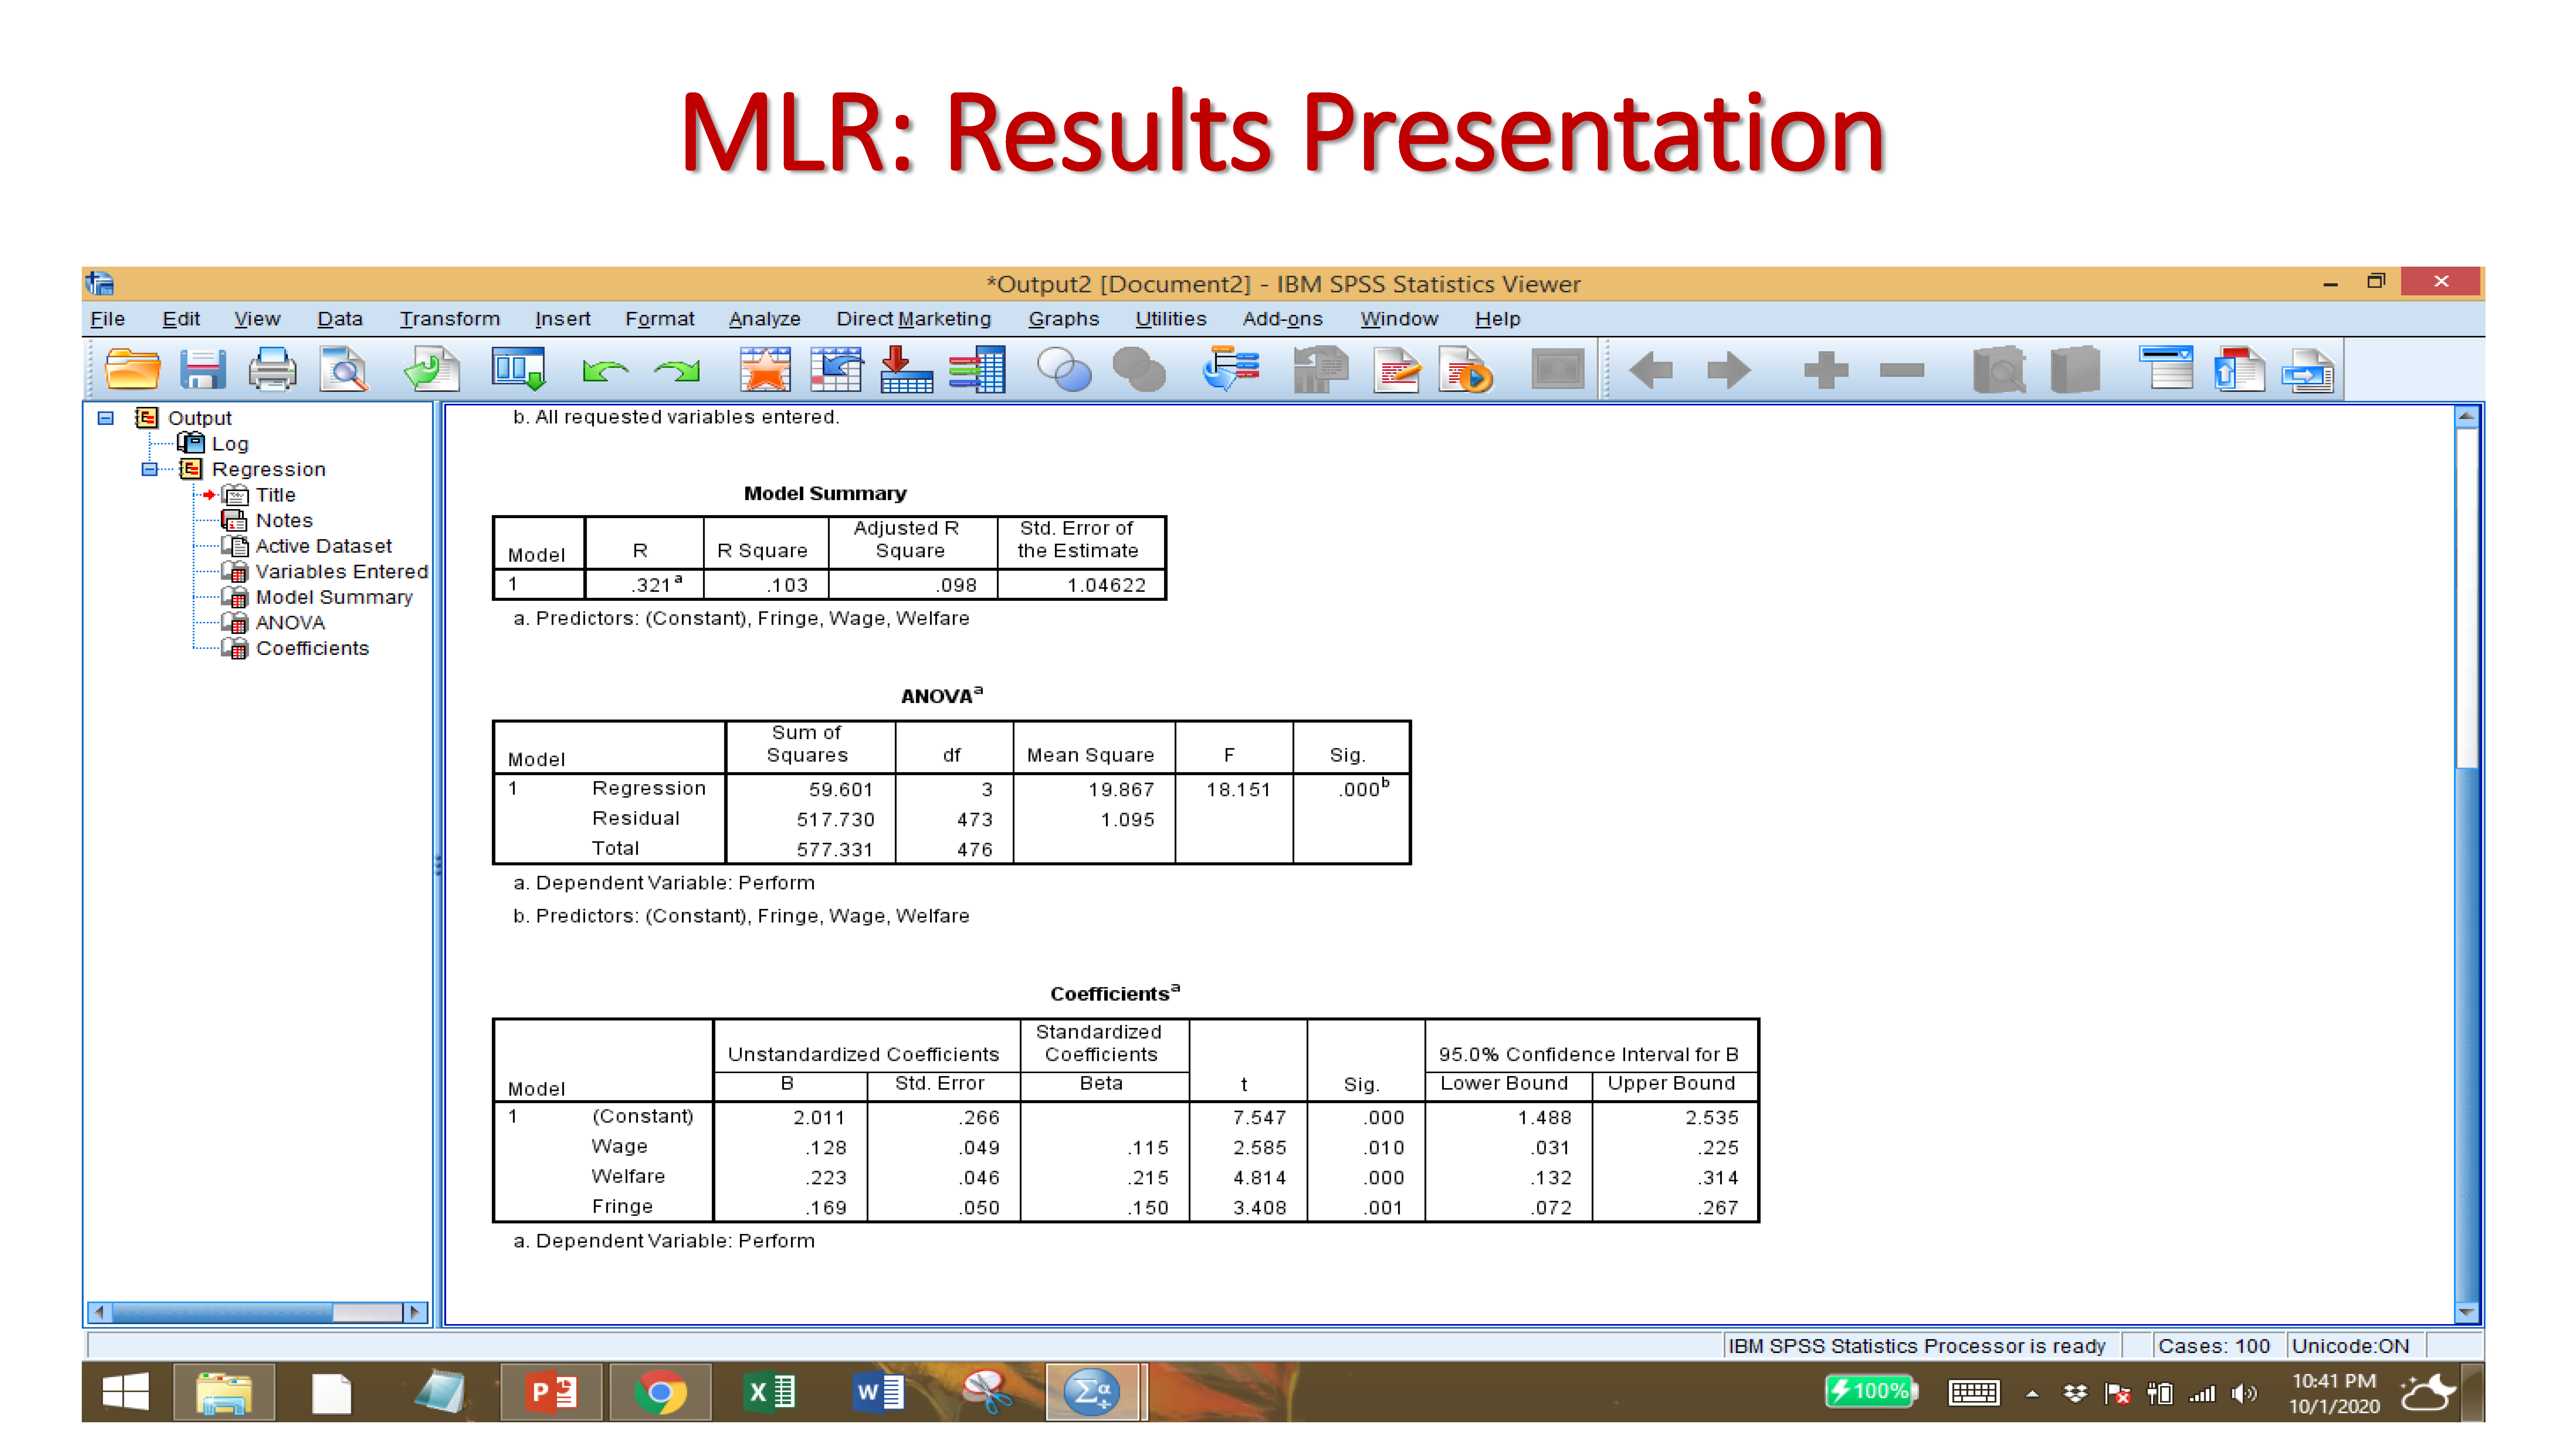
B-Value: Unstandardized coefficients are ‘raw’ coefficients produced by regression analysis when the analysis is performed on original, unstandardized variables. … An unstandardized coefficient represents the amount of change in a dependent variable Y due to a change of 1 unit of independent variable X.
Standard Error: The standard error of a statistic is the standard deviation of its sampling distribution or an estimate of that standard deviation. If the parameter or the statistic is the mean, it is called the standard error of the mean.
Beta: The beta values in regression are the estimated coefficients of the explanatory variables indicating a change on response variable caused by a unit change of respective explanatory variable keeping all the other explanatory variables constant/unchanged.
Significant t-value: The t-value measures the size of the difference relative to the variation in your sample data. Put another way, T is simply the calculated difference represented in units of standard error. The greater the magnitude of T, the greater the evidence against the null hypothesis. Null hypothesis is rejected if the t-value is more than or equal to 1.96 (two-tail) and 1.64 (one-tail)
Significant P-Value: The p-value for each term tests the null hypothesis that the coefficient is equal to zero (no effect). A low p-value (< 0.05) indicates that you can reject the null hypothesis.
Confidence interval: A 95% confidence interval is a range of values that you can be 95% certain contains the true mean of the population.
R-squared: R-squared is a statistical measure of how close the data are to the fitted regression line. It is also known as the coefficient of determination, or the coefficient of multiple determination for multiple regression. … 100% indicates that the model explains all the variability of the response data around its mean.
Adjusted R-squared: The adjusted R-squared is a modified version of R-squared that has been adjusted for the number of predictors in the model. The adjusted R-squared increases only if the new term improves the model more than would be expected by chance. It decreases when a predictor improves the model by less than expected by chance.
